
 Yahoo Finance
 Those who invested in Crescendo Corporation Berhad (KLSE:CRESNDO) a year ago are up 230%
When you buy shares in a company, there is always a risk that the price drops to zero. But if you pick the right stock, you can make a lot more than 100%. For example, the Crescendo Corporation Berhad (KLSE:CRESNDO) share price had more than doubled in just one year - up 209%. Also pleasing for shareholders was the 39% gain in the last three months. And shareholders have also done well over the long term, with an increase of 197% in the last three years.
So let's assess the underlying fundamentals over the last 1 year and see if they've moved in lock-step with shareholder returns.
Check out our latest analysis for Crescendo Corporation Berhad
There is no denying that markets are sometimes efficient, but prices do not always reflect underlying business performance. By comparing earnings per share (EPS) and share price changes over time, we can get a feel for how investor attitudes to a company have morphed over time.
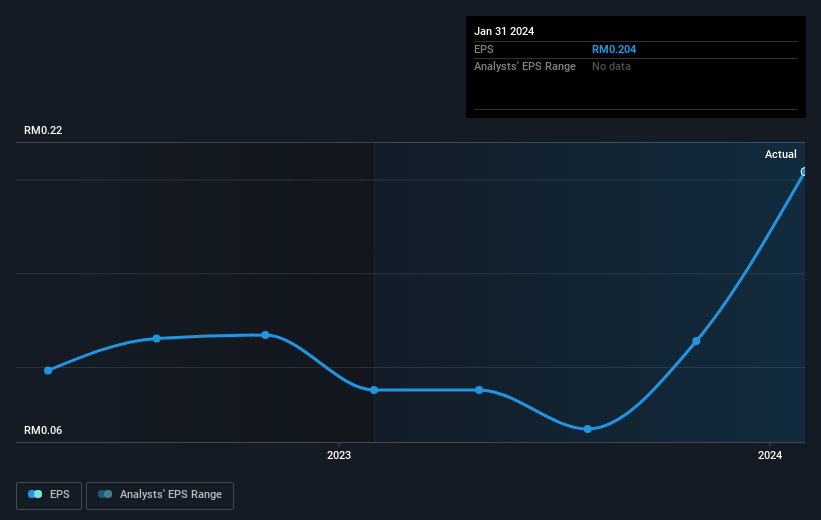
Crescendo Corporation Berhad was able to grow EPS by 133% in the last twelve months. The share price gain of 209% certainly outpaced the EPS growth. So it's fair to assume the market has a higher opinion of the business than it a year ago.
You can see how EPS has changed over time in the image below (click on the chart to see the exact values).
Dive deeper into Crescendo Corporation Berhad's key metrics by checking this interactive graph of Crescendo Corporation Berhad's earnings, revenue and cash flow.
What About Dividends?
When looking at investment returns, it is important to consider the difference between total shareholder return (TSR) and share price return. Whereas the share price return only reflects the change in the share price, the TSR includes the value of dividends (assuming they were reinvested) and the benefit of any discounted capital raising or spin-off. So for companies that pay a generous dividend, the TSR is often a lot higher than the share price return. As it happens, Crescendo Corporation Berhad's TSR for the last 1 year was 230%, which exceeds the share price return mentioned earlier. And there's no prize for guessing that the dividend payments largely explain the divergence!
A Different Perspective
We're pleased to report that Crescendo Corporation Berhad shareholders have received a total shareholder return of 230% over one year. Of course, that includes the dividend. That's better than the annualised return of 30% over half a decade, implying that the company is doing better recently. Someone with an optimistic perspective could view the recent improvement in TSR as indicating that the business itself is getting better with time. Before deciding if you like the current share price, check how Crescendo Corporation Berhad scores on these 3 valuation metrics.
But note: Crescendo Corporation Berhad may not be the best stock to buy. So take a peek at this free list of interesting companies with past earnings growth (and further growth forecast).
Please note, the market returns quoted in this article reflect the market weighted average returns of stocks that currently trade on Malaysian exchanges.
Have feedback on this article? Concerned about the content? Get in touch with us directly. Alternatively, email editorial-team (at) simplywallst.com.
This article by Simply Wall St is general in nature. We provide commentary based on historical data and analyst forecasts only using an unbiased methodology and our articles are not intended to be financial advice. It does not constitute a recommendation to buy or sell any stock, and does not take account of your objectives, or your financial situation. We aim to bring you long-term focused analysis driven by fundamental data. Note that our analysis may not factor in the latest price-sensitive company announcements or qualitative material. Simply Wall St has no position in any stocks mentioned.
