
 Yahoo Finance
 Those who invested in Church & Dwight (NYSE:CHD) five years ago are up 51%
The main point of investing for the long term is to make money. But more than that, you probably want to see it rise more than the market average. But Church & Dwight Co., Inc. (NYSE:CHD) has fallen short of that second goal, with a share price rise of 43% over five years, which is below the market return. Zooming in, the stock is up a respectable 12% in the last year.
So let's investigate and see if the longer term performance of the company has been in line with the underlying business' progress.
View our latest analysis for Church & Dwight
To quote Buffett, 'Ships will sail around the world but the Flat Earth Society will flourish. There will continue to be wide discrepancies between price and value in the marketplace...' One imperfect but simple way to consider how the market perception of a company has shifted is to compare the change in the earnings per share (EPS) with the share price movement.
Over half a decade, Church & Dwight managed to grow its earnings per share at 6.0% a year. So the EPS growth rate is rather close to the annualized share price gain of 7% per year. That suggests that the market sentiment around the company hasn't changed much over that time. Indeed, it would appear the share price is reacting to the EPS.
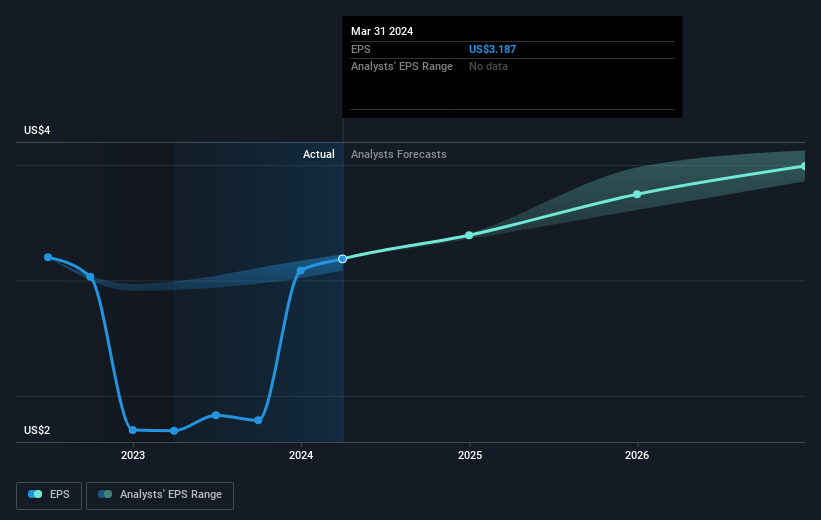
The company's earnings per share (over time) is depicted in the image below (click to see the exact numbers).
We know that Church & Dwight has improved its bottom line lately, but is it going to grow revenue? This free report showing analyst revenue forecasts should help you figure out if the EPS growth can be sustained.
What About Dividends?
It is important to consider the total shareholder return, as well as the share price return, for any given stock. The TSR incorporates the value of any spin-offs or discounted capital raisings, along with any dividends, based on the assumption that the dividends are reinvested. It's fair to say that the TSR gives a more complete picture for stocks that pay a dividend. In the case of Church & Dwight, it has a TSR of 51% for the last 5 years. That exceeds its share price return that we previously mentioned. This is largely a result of its dividend payments!
A Different Perspective
Church & Dwight shareholders gained a total return of 14% during the year. Unfortunately this falls short of the market return. The silver lining is that the gain was actually better than the average annual return of 9% per year over five year. This suggests the company might be improving over time. It's always interesting to track share price performance over the longer term. But to understand Church & Dwight better, we need to consider many other factors. For instance, we've identified 1 warning sign for Church & Dwight that you should be aware of.
If you like to buy stocks alongside management, then you might just love this free list of companies. (Hint: many of them are unnoticed AND have attractive valuation).
Please note, the market returns quoted in this article reflect the market weighted average returns of stocks that currently trade on American exchanges.
Have feedback on this article? Concerned about the content? Get in touch with us directly. Alternatively, email editorial-team (at) simplywallst.com.
This article by Simply Wall St is general in nature. We provide commentary based on historical data and analyst forecasts only using an unbiased methodology and our articles are not intended to be financial advice. It does not constitute a recommendation to buy or sell any stock, and does not take account of your objectives, or your financial situation. We aim to bring you long-term focused analysis driven by fundamental data. Note that our analysis may not factor in the latest price-sensitive company announcements or qualitative material. Simply Wall St has no position in any stocks mentioned.
