
 Yahoo Finance
 There's Been No Shortage Of Growth Recently For Peabody Energy's (NYSE:BTU) Returns On Capital
If we want to find a potential multi-bagger, often there are underlying trends that can provide clues. Firstly, we'll want to see a proven return on capital employed (ROCE) that is increasing, and secondly, an expanding base of capital employed. This shows us that it's a compounding machine, able to continually reinvest its earnings back into the business and generate higher returns. Speaking of which, we noticed some great changes in Peabody Energy's (NYSE:BTU) returns on capital, so let's have a look.
Return On Capital Employed (ROCE): What Is It?
For those who don't know, ROCE is a measure of a company's yearly pre-tax profit (its return), relative to the capital employed in the business. To calculate this metric for Peabody Energy, this is the formula:
Return on Capital Employed = Earnings Before Interest and Tax (EBIT) ÷ (Total Assets - Current Liabilities)
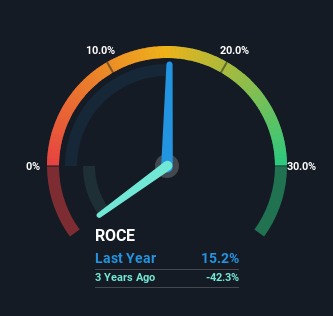
0.15 = US$750m ÷ (US$5.7b - US$805m) (Based on the trailing twelve months to March 2024).
Thus, Peabody Energy has an ROCE of 15%. In absolute terms, that's a satisfactory return, but compared to the Oil and Gas industry average of 13% it's much better.
Check out our latest analysis for Peabody Energy
Above you can see how the current ROCE for Peabody Energy compares to its prior returns on capital, but there's only so much you can tell from the past. If you'd like, you can check out the forecasts from the analysts covering Peabody Energy for free.
How Are Returns Trending?
Peabody Energy has not disappointed in regards to ROCE growth. The figures show that over the last five years, returns on capital have grown by 92%. That's not bad because this tells for every dollar invested (capital employed), the company is increasing the amount earned from that dollar. Speaking of capital employed, the company is actually utilizing 21% less than it was five years ago, which can be indicative of a business that's improving its efficiency. If this trend continues, the business might be getting more efficient but it's shrinking in terms of total assets.
The Bottom Line
In a nutshell, we're pleased to see that Peabody Energy has been able to generate higher returns from less capital. And given the stock has remained rather flat over the last five years, there might be an opportunity here if other metrics are strong. With that in mind, we believe the promising trends warrant this stock for further investigation.
Peabody Energy does come with some risks though, we found 2 warning signs in our investment analysis, and 1 of those can't be ignored...
If you want to search for solid companies with great earnings, check out this free list of companies with good balance sheets and impressive returns on equity.
Have feedback on this article? Concerned about the content? Get in touch with us directly. Alternatively, email editorial-team (at) simplywallst.com.
This article by Simply Wall St is general in nature. We provide commentary based on historical data and analyst forecasts only using an unbiased methodology and our articles are not intended to be financial advice. It does not constitute a recommendation to buy or sell any stock, and does not take account of your objectives, or your financial situation. We aim to bring you long-term focused analysis driven by fundamental data. Note that our analysis may not factor in the latest price-sensitive company announcements or qualitative material. Simply Wall St has no position in any stocks mentioned.
Have feedback on this article? Concerned about the content? Get in touch with us directly. Alternatively, email editorial-team@simplywallst.com
