
 Yahoo Finance
 There's Been No Shortage Of Growth Recently For SunOpta's (NASDAQ:STKL) Returns On Capital
If you're looking for a multi-bagger, there's a few things to keep an eye out for. Firstly, we'll want to see a proven return on capital employed (ROCE) that is increasing, and secondly, an expanding base of capital employed. This shows us that it's a compounding machine, able to continually reinvest its earnings back into the business and generate higher returns. So on that note, SunOpta (NASDAQ:STKL) looks quite promising in regards to its trends of return on capital.
What Is Return On Capital Employed (ROCE)?
If you haven't worked with ROCE before, it measures the 'return' (pre-tax profit) a company generates from capital employed in its business. Analysts use this formula to calculate it for SunOpta:
Return on Capital Employed = Earnings Before Interest and Tax (EBIT) ÷ (Total Assets - Current Liabilities)
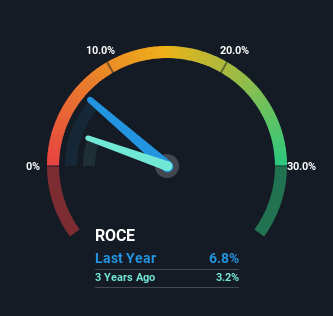
0.068 = US$35m ÷ (US$672m - US$154m) (Based on the trailing twelve months to March 2024).
Therefore, SunOpta has an ROCE of 6.8%. In absolute terms, that's a low return and it also under-performs the Food industry average of 11%.
See our latest analysis for SunOpta
Above you can see how the current ROCE for SunOpta compares to its prior returns on capital, but there's only so much you can tell from the past. If you'd like, you can check out the forecasts from the analysts covering SunOpta for free.
What Does the ROCE Trend For SunOpta Tell Us?
SunOpta is showing promise given that its ROCE is trending up and to the right. Looking at the data, we can see that even though capital employed in the business has remained relatively flat, the ROCE generated has risen by 313% over the last five years. So it's likely that the business is now reaping the full benefits of its past investments, since the capital employed hasn't changed considerably. The company is doing well in that sense, and it's worth investigating what the management team has planned for long term growth prospects.
In another part of our analysis, we noticed that the company's ratio of current liabilities to total assets decreased to 23%, which broadly means the business is relying less on its suppliers or short-term creditors to fund its operations. This tells us that SunOpta has grown its returns without a reliance on increasing their current liabilities, which we're very happy with.
Our Take On SunOpta's ROCE
To sum it up, SunOpta is collecting higher returns from the same amount of capital, and that's impressive. And with a respectable 49% awarded to those who held the stock over the last five years, you could argue that these developments are starting to get the attention they deserve. So given the stock has proven it has promising trends, it's worth researching the company further to see if these trends are likely to persist.
One more thing, we've spotted 3 warning signs facing SunOpta that you might find interesting.
For those who like to invest in solid companies, check out this free list of companies with solid balance sheets and high returns on equity.
Have feedback on this article? Concerned about the content? Get in touch with us directly. Alternatively, email editorial-team (at) simplywallst.com.
This article by Simply Wall St is general in nature. We provide commentary based on historical data and analyst forecasts only using an unbiased methodology and our articles are not intended to be financial advice. It does not constitute a recommendation to buy or sell any stock, and does not take account of your objectives, or your financial situation. We aim to bring you long-term focused analysis driven by fundamental data. Note that our analysis may not factor in the latest price-sensitive company announcements or qualitative material. Simply Wall St has no position in any stocks mentioned.
