
 Yahoo Finance
 There's Been No Shortage Of Growth Recently For Frasers Group's (LON:FRAS) Returns On Capital
If you're not sure where to start when looking for the next multi-bagger, there are a few key trends you should keep an eye out for. Ideally, a business will show two trends; firstly a growing return on capital employed (ROCE) and secondly, an increasing amount of capital employed. This shows us that it's a compounding machine, able to continually reinvest its earnings back into the business and generate higher returns. So on that note, Frasers Group (LON:FRAS) looks quite promising in regards to its trends of return on capital.
What Is Return On Capital Employed (ROCE)?
For those who don't know, ROCE is a measure of a company's yearly pre-tax profit (its return), relative to the capital employed in the business. To calculate this metric for Frasers Group, this is the formula:
Return on Capital Employed = Earnings Before Interest and Tax (EBIT) ÷ (Total Assets - Current Liabilities)
0.14 = UK£486m ÷ (UK£4.6b - UK£1.3b) (Based on the trailing twelve months to October 2023).
Therefore, Frasers Group has an ROCE of 14%. In absolute terms, that's a pretty normal return, and it's somewhat close to the Specialty Retail industry average of 12%.
Check out our latest analysis for Frasers Group
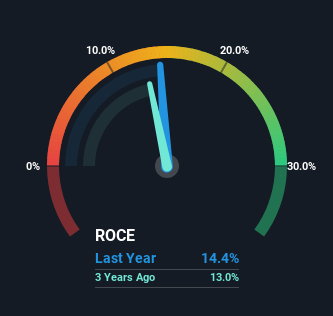
Above you can see how the current ROCE for Frasers Group compares to its prior returns on capital, but there's only so much you can tell from the past. If you're interested, you can view the analysts predictions in our free analyst report for Frasers Group .
What Does the ROCE Trend For Frasers Group Tell Us?
The trends we've noticed at Frasers Group are quite reassuring. The numbers show that in the last five years, the returns generated on capital employed have grown considerably to 14%. Basically the business is earning more per dollar of capital invested and in addition to that, 51% more capital is being employed now too. The increasing returns on a growing amount of capital is common amongst multi-baggers and that's why we're impressed.
Our Take On Frasers Group's ROCE
In summary, it's great to see that Frasers Group can compound returns by consistently reinvesting capital at increasing rates of return, because these are some of the key ingredients of those highly sought after multi-baggers. And a remarkable 232% total return over the last five years tells us that investors are expecting more good things to come in the future. So given the stock has proven it has promising trends, it's worth researching the company further to see if these trends are likely to persist.
If you'd like to know more about Frasers Group, we've spotted 2 warning signs, and 1 of them is concerning.
While Frasers Group may not currently earn the highest returns, we've compiled a list of companies that currently earn more than 25% return on equity. Check out this free list here.
Have feedback on this article? Concerned about the content? Get in touch with us directly. Alternatively, email editorial-team (at) simplywallst.com.
This article by Simply Wall St is general in nature. We provide commentary based on historical data and analyst forecasts only using an unbiased methodology and our articles are not intended to be financial advice. It does not constitute a recommendation to buy or sell any stock, and does not take account of your objectives, or your financial situation. We aim to bring you long-term focused analysis driven by fundamental data. Note that our analysis may not factor in the latest price-sensitive company announcements or qualitative material. Simply Wall St has no position in any stocks mentioned.
Have feedback on this article? Concerned about the content? Get in touch with us directly. Alternatively, email editorial-team@simplywallst.com
