
 Yahoo Finance
 Team (NYSE:TISI) Is In A Good Position To Deliver On Growth Plans
Just because a business does not make any money, does not mean that the stock will go down. For example, although Amazon.com made losses for many years after listing, if you had bought and held the shares since 1999, you would have made a fortune. But while the successes are well known, investors should not ignore the very many unprofitable companies that simply burn through all their cash and collapse.
So should Team (NYSE:TISI) shareholders be worried about its cash burn? In this report, we will consider the company's annual negative free cash flow, henceforth referring to it as the 'cash burn'. First, we'll determine its cash runway by comparing its cash burn with its cash reserves.
See our latest analysis for Team
When Might Team Run Out Of Money?
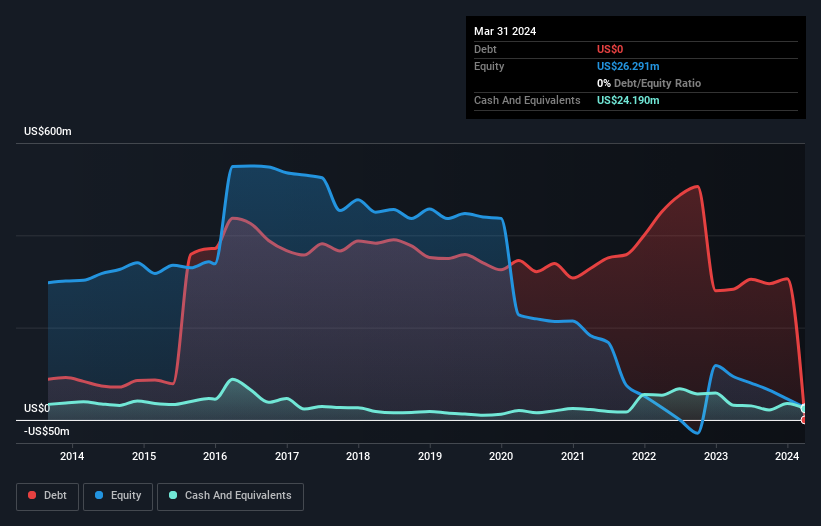
A cash runway is defined as the length of time it would take a company to run out of money if it kept spending at its current rate of cash burn. In March 2024, Team had US$24m in cash, and was debt-free. In the last year, its cash burn was US$2.1m. So it had a very long cash runway of many years from March 2024. Even though this is but one measure of the company's cash burn, the thought of such a long cash runway warms our bellies in a comforting way. Depicted below, you can see how its cash holdings have changed over time.
How Well Is Team Growing?
Given our focus on Team's cash burn, we're delighted to see that it reduced its cash burn by a nifty 95%. However, operating revenue growth was flat over the period. We think it is growing rather well, upon reflection. Of course, we've only taken a quick look at the stock's growth metrics, here. You can take a look at how Team has developed its business over time by checking this visualization of its revenue and earnings history.
How Easily Can Team Raise Cash?
We are certainly impressed with the progress Team has made over the last year, but it is also worth considering how costly it would be if it wanted to raise more cash to fund faster growth. Generally speaking, a listed business can raise new cash through issuing shares or taking on debt. One of the main advantages held by publicly listed companies is that they can sell shares to investors to raise cash and fund growth. We can compare a company's cash burn to its market capitalisation to get a sense for how many new shares a company would have to issue to fund one year's operations.
Team's cash burn of US$2.1m is about 5.4% of its US$39m market capitalisation. That's a low proportion, so we figure the company would be able to raise more cash to fund growth, with a little dilution, or even to simply borrow some money.
How Risky Is Team's Cash Burn Situation?
It may already be apparent to you that we're relatively comfortable with the way Team is burning through its cash. In particular, we think its cash burn reduction stands out as evidence that the company is well on top of its spending. On this analysis its revenue growth was its weakest feature, but we are not concerned about it. After taking into account the various metrics mentioned in this report, we're pretty comfortable with how the company is spending its cash, as it seems on track to meet its needs over the medium term. On another note, we conducted an in-depth investigation of the company, and identified 3 warning signs for Team (1 doesn't sit too well with us!) that you should be aware of before investing here.
Of course, you might find a fantastic investment by looking elsewhere. So take a peek at this free list of interesting companies, and this list of stocks growth stocks (according to analyst forecasts)
Have feedback on this article? Concerned about the content? Get in touch with us directly. Alternatively, email editorial-team (at) simplywallst.com.
This article by Simply Wall St is general in nature. We provide commentary based on historical data and analyst forecasts only using an unbiased methodology and our articles are not intended to be financial advice. It does not constitute a recommendation to buy or sell any stock, and does not take account of your objectives, or your financial situation. We aim to bring you long-term focused analysis driven by fundamental data. Note that our analysis may not factor in the latest price-sensitive company announcements or qualitative material. Simply Wall St has no position in any stocks mentioned.
