
 Yahoo Finance
 Straits Times Index approaches five times tested resistance again as US risk-free rates fall

The STI's breakout level remains at 3,306. US risk-free rates have fallen below the 100-day moving average
The Straits Times Index ended the week of Jan 9-13 at 3,296, up 17 points week-on-week. On Jan 9, the STI formed a shooting star-like pattern on the candlestick chart when the index rose to a high of 3,325 but closed at its low, at 3,305. The closing price represents the area near the four times tested resistance at 3,306. This level continues to pose significant resistance and a successful breakout would be meaningful but appears unlikely.
At present, the STI may not have sufficient momentum to break out of this resistance. Indeed, quarterly momentum continues to rise. However directional movement indicators do not support an uptrend. ADX is at 12, which is low and indicates a sideways trend. This is despite the DIs being positively placed.
It may take another quarter of consolidation before the STI makes its break. Interestingly, a successful breakout indicates a significant upside objective.
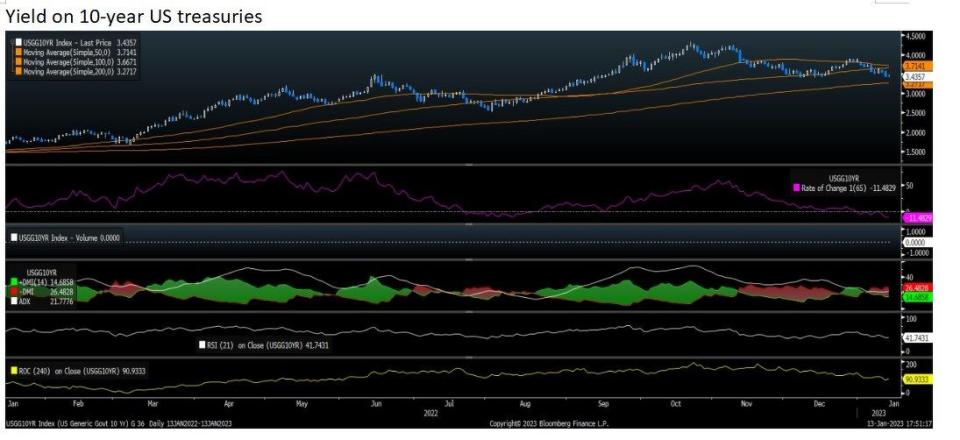
Elsewhere, directional movement indicators suggest that the chart of the yield on the 10-year US treasuries is turning increasingly weaker. Here, ADX has flattened at 14, as DIs are negatively placed, an indication of a potential decline. To confirm this, quarterly momentum has broken below its equilibrium line and continues to fall.
While markets can change their mind, the chart pattern is currently weak. The 10-year yield has fallen below both its 50- and 100-day moving averages at 3.1741% and 3.6671% respectively. Both moving averages could start to draw together in preparation for a negative cross. The yield is attempting to break below the next important support at 3.44%. If this materialises, the downside objective would be indicated.
See Also:
Click here to stay updated with the Latest Business & Investment News in Singapore
Straits Times Index’s level to watch is its four-times tested resistance
With a yen for bargain, will Japan be the dark horse of 2023?
Get in-depth insights from our expert contributors, and dive into financial and economic trends
