
 Yahoo Finance
 Stanley Black & Decker Inc's Dividend Analysis
Exploring the Dividend Performance and Sustainability of SWK
Stanley Black & Decker Inc (NYSE:SWK) recently announced a dividend of $0.81 per share, payable on 2024-06-18, with the ex-dividend date set for 2024-06-04. As investors look forward to this upcoming payment, the spotlight also shines on the company's dividend history, yield, and growth rates. Using the data from GuruFocus, let's look into Stanley Black & Decker Inc's dividend performance and assess its sustainability.
What Does Stanley Black & Decker Inc Do?
This Powerful Chart Made Peter Lynch 29% A Year For 13 Years
How to calculate the intrinsic value of a stock?
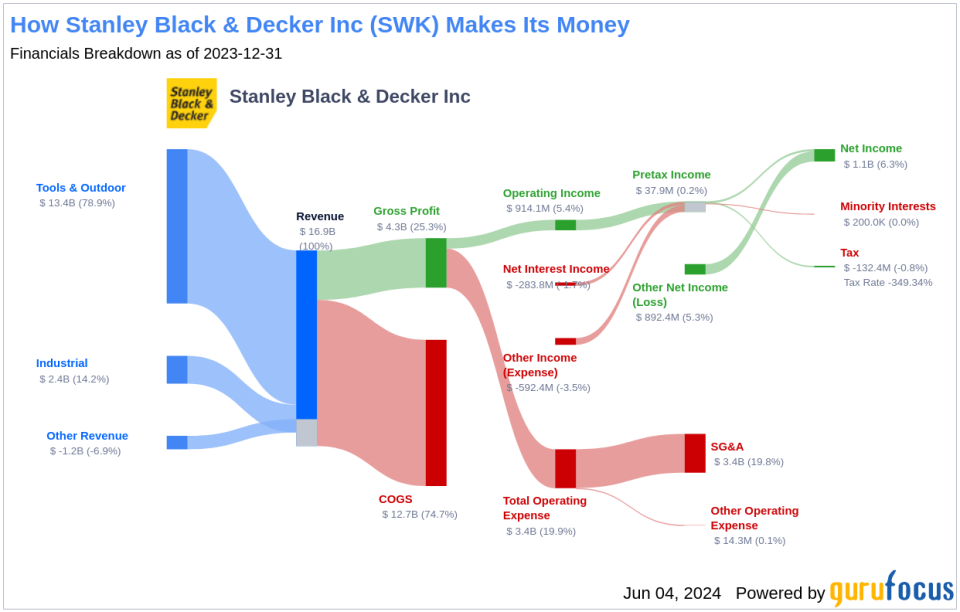
Stanley Black & Decker Inc is a manufacturer of hand and power tools. The company operates in two reportable segments namely Tools and Outdoor and Industrial. It generates maximum revenue from the Tools and Outdoor segment. The Tools and Outdoor segment is comprised of the Power Tools Group (PTG), Hand Tools, Accessories and Storage (HTAS), and Outdoor Power Equipment (Outdoor) businesses. Geographically, the company generates revenue from the United States, Canada, Other Americas, Europe, and Asia. It derives a majority of its revenue from the United States.
A Glimpse at Stanley Black & Decker Inc's Dividend History
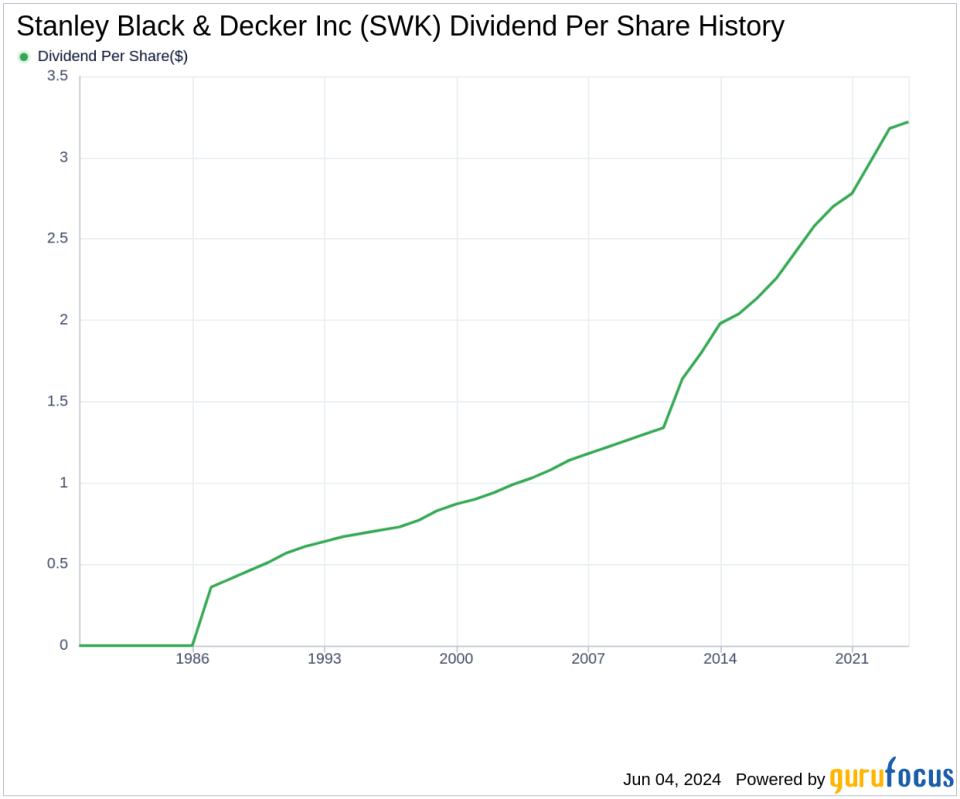
Stanley Black & Decker Inc has maintained a consistent dividend payment record since 1968. Dividends are currently distributed on a quarterly basis. Stanley Black & Decker Inc has increased its dividend each year since 1968. The stock is thus listed as a dividend king, an honor that is given to companies that have increased their dividend each year for at least the past 56 years. Below is a chart showing annual Dividends Per Share for tracking historical trends.
Breaking Down Stanley Black & Decker Inc's Dividend Yield and Growth
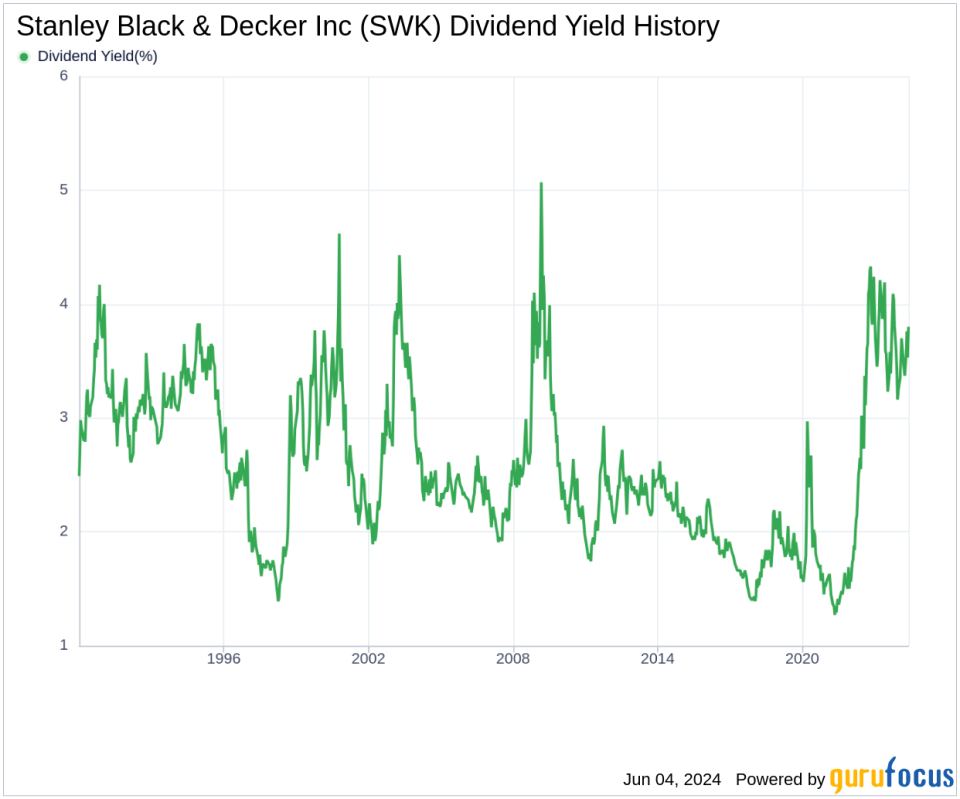
As of today, Stanley Black & Decker Inc currently has a 12-month trailing dividend yield of 3.70% and a 12-month forward dividend yield of 3.71%. This suggests an expectation of increased dividend payments over the next 12 months. Over the past three years, Stanley Black & Decker Inc's annual dividend growth rate was 5.00%. Extended to a five-year horizon, this rate decreased to 4.90% per year. And over the past decade, Stanley Black & Decker Inc's annual dividends per share growth rate stands at 5.30%. Based on Stanley Black & Decker Inc's dividend yield and five-year growth rate, the 5-year yield on cost of Stanley Black & Decker Inc stock as of today is approximately 4.70%.
The Sustainability Question: Payout Ratio and Profitability
To assess the sustainability of the dividend, one needs to evaluate the company's payout ratio. The dividend payout ratio provides insights into the portion of earnings the company distributes as dividends. A lower ratio suggests that the company retains a significant part of its earnings, thereby ensuring the availability of funds for future growth and unexpected downturns. As of 2024-03-31, Stanley Black & Decker Inc's dividend payout ratio is 1.33, which may suggest that the company's dividend may not be sustainable. Stanley Black & Decker Inc's profitability rank, offers an understanding of the company's earnings prowess relative to its peers. GuruFocus ranks Stanley Black & Decker Inc's profitability 7 out of 10 as of 2024-03-31, suggesting good profitability prospects. The company has reported net profit in 9 years out of past 10 years.
Growth Metrics: The Future Outlook
To ensure the sustainability of dividends, a company must have robust growth metrics. Stanley Black & Decker Inc's growth rank of 7 out of 10 suggests that the company's growth trajectory is good relative to its competitors. Revenue is the lifeblood of any company, and Stanley Black & Decker Inc's revenue per share, combined with the 3-year revenue growth rate, indicates a strong revenue model. Stanley Black & Decker Inc's revenue has increased by approximately 9.40% per year on average, a rate that outperforms than approximately 52.47% of global competitors. The company's 3-year EPS growth rate showcases its capability to grow its earnings, a critical component for sustaining dividends in the long run. During the past three years, Stanley Black & Decker Inc's earnings increased by approximately -43.30% per year on average, a rate that outperforms than approximately 6.25% of global competitors. Lastly, the company's 5-year EBITDA growth rate of -17.50%, which outperforms than approximately 9.25% of global competitors.
Next Steps
Considering Stanley Black & Decker Inc's consistent dividend payments, growth in dividend rates, and robust profitability and growth metrics, the company presents a compelling case for investors seeking reliable dividend income. However, the high payout ratio could be a concern, necessitating close monitoring. Investors should consider both the opportunities and risks associated with Stanley Black & Decker Inc's dividend strategy. GuruFocus Premium users can screen for high-dividend yield stocks using the High Dividend Yield Screener.
This article, generated by GuruFocus, is designed to provide general insights and is not tailored financial advice. Our commentary is rooted in historical data and analyst projections, utilizing an impartial methodology, and is not intended to serve as specific investment guidance. It does not formulate a recommendation to purchase or divest any stock and does not consider individual investment objectives or financial circumstances. Our objective is to deliver long-term, fundamental data-driven analysis. Be aware that our analysis might not incorporate the most recent, price-sensitive company announcements or qualitative information. GuruFocus holds no position in the stocks mentioned herein.
This article first appeared on GuruFocus.
