
 Yahoo Finance
 Stadio Holdings (JSE:SDO) Might Have The Makings Of A Multi-Bagger
If you're not sure where to start when looking for the next multi-bagger, there are a few key trends you should keep an eye out for. One common approach is to try and find a company with returns on capital employed (ROCE) that are increasing, in conjunction with a growing amount of capital employed. Put simply, these types of businesses are compounding machines, meaning they are continually reinvesting their earnings at ever-higher rates of return. So on that note, Stadio Holdings (JSE:SDO) looks quite promising in regards to its trends of return on capital.
Understanding Return On Capital Employed (ROCE)
Just to clarify if you're unsure, ROCE is a metric for evaluating how much pre-tax income (in percentage terms) a company earns on the capital invested in its business. The formula for this calculation on Stadio Holdings is:
Return on Capital Employed = Earnings Before Interest and Tax (EBIT) ÷ (Total Assets - Current Liabilities)
0.15 = R308m ÷ (R2.3b - R322m) (Based on the trailing twelve months to December 2023).
So, Stadio Holdings has an ROCE of 15%. That's a relatively normal return on capital, and it's around the 16% generated by the Consumer Services industry.
Check out our latest analysis for Stadio Holdings
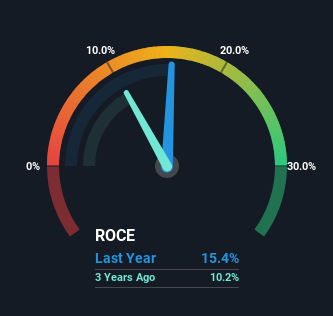
Historical performance is a great place to start when researching a stock so above you can see the gauge for Stadio Holdings' ROCE against it's prior returns. If you'd like to look at how Stadio Holdings has performed in the past in other metrics, you can view this free graph of Stadio Holdings' past earnings, revenue and cash flow.
What The Trend Of ROCE Can Tell Us
Stadio Holdings is showing promise given that its ROCE is trending up and to the right. Looking at the data, we can see that even though capital employed in the business has remained relatively flat, the ROCE generated has risen by 186% over the last five years. Basically the business is generating higher returns from the same amount of capital and that is proof that there are improvements in the company's efficiencies. It's worth looking deeper into this though because while it's great that the business is more efficient, it might also mean that going forward the areas to invest internally for the organic growth are lacking.
The Key Takeaway
In summary, we're delighted to see that Stadio Holdings has been able to increase efficiencies and earn higher rates of return on the same amount of capital. And with a respectable 46% awarded to those who held the stock over the last five years, you could argue that these developments are starting to get the attention they deserve. In light of that, we think it's worth looking further into this stock because if Stadio Holdings can keep these trends up, it could have a bright future ahead.
While Stadio Holdings looks impressive, no company is worth an infinite price. The intrinsic value infographic for SDO helps visualize whether it is currently trading for a fair price.
If you want to search for solid companies with great earnings, check out this free list of companies with good balance sheets and impressive returns on equity.
Have feedback on this article? Concerned about the content? Get in touch with us directly. Alternatively, email editorial-team (at) simplywallst.com.
This article by Simply Wall St is general in nature. We provide commentary based on historical data and analyst forecasts only using an unbiased methodology and our articles are not intended to be financial advice. It does not constitute a recommendation to buy or sell any stock, and does not take account of your objectives, or your financial situation. We aim to bring you long-term focused analysis driven by fundamental data. Note that our analysis may not factor in the latest price-sensitive company announcements or qualitative material. Simply Wall St has no position in any stocks mentioned.
