
 Yahoo Finance
 Solvay SA's Dividend Analysis
Exploring the Dividend Performance of Solvay SA (SLVYY)
Solvay SA (SLVYY) recently announced a dividend of $0.09 per share, payable on 2024-06-20, with the ex-dividend date set for 2024-06-04. As investors look forward to this upcoming payment, the spotlight also shines on the company's dividend history, yield, and growth rates. Using the data from GuruFocus, let's look into Solvay SA's dividend performance and assess its sustainability.
What Does Solvay SA Do?
Warning! GuruFocus has detected 15 Warning Signs with SLVYY.
This Powerful Chart Made Peter Lynch 29% A Year For 13 Years
How to calculate the intrinsic value of a stock?
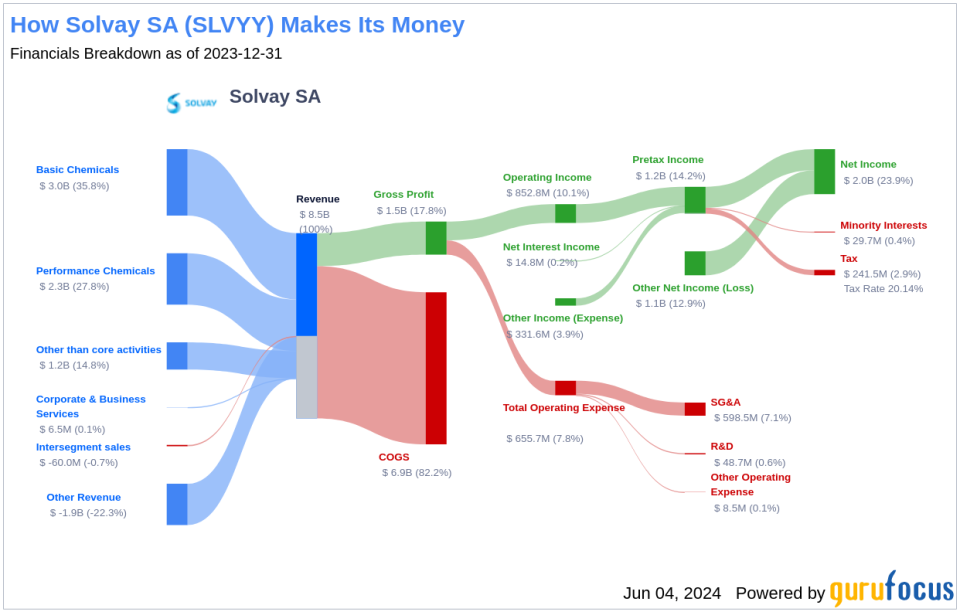
Solvay SA is a Belgium-based producer of chemicals, plastics, and composites. Their five major businesses include soda ash, peroxides, silica, rare earths, and fluorine. The company has a top-three market position for nearly all of its products. Key business segments include Basic Chemicals, Performance Chemicals, and Corporate. High-value products include aerospace composites and specialty polymers while traditional chemical products include soda ash and hydrogen peroxide. Geographical exposure is relatively balanced, with Europe, North America, and Asia each contributing a third of sales.
A Glimpse at Solvay SA's Dividend History
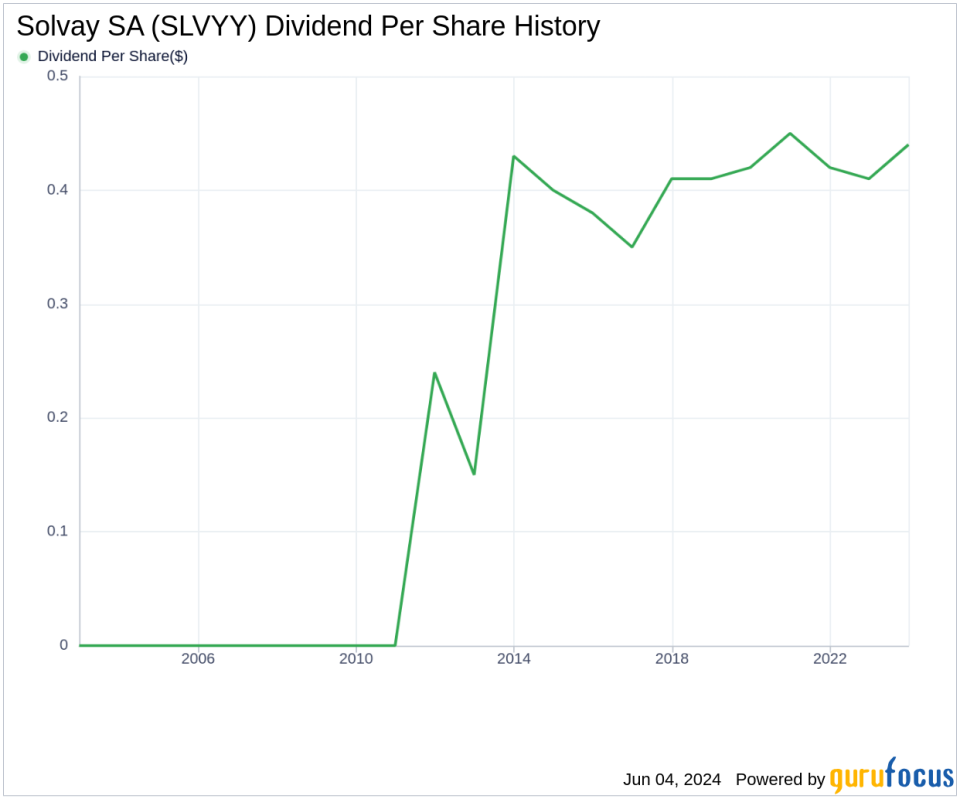
Solvay SA has maintained a consistent dividend payment record since 2011. Dividends are currently distributed on a bi-annually basis. Below is a chart showing annual Dividends Per Share for tracking historical trends.
Breaking Down Solvay SA's Dividend Yield and Growth
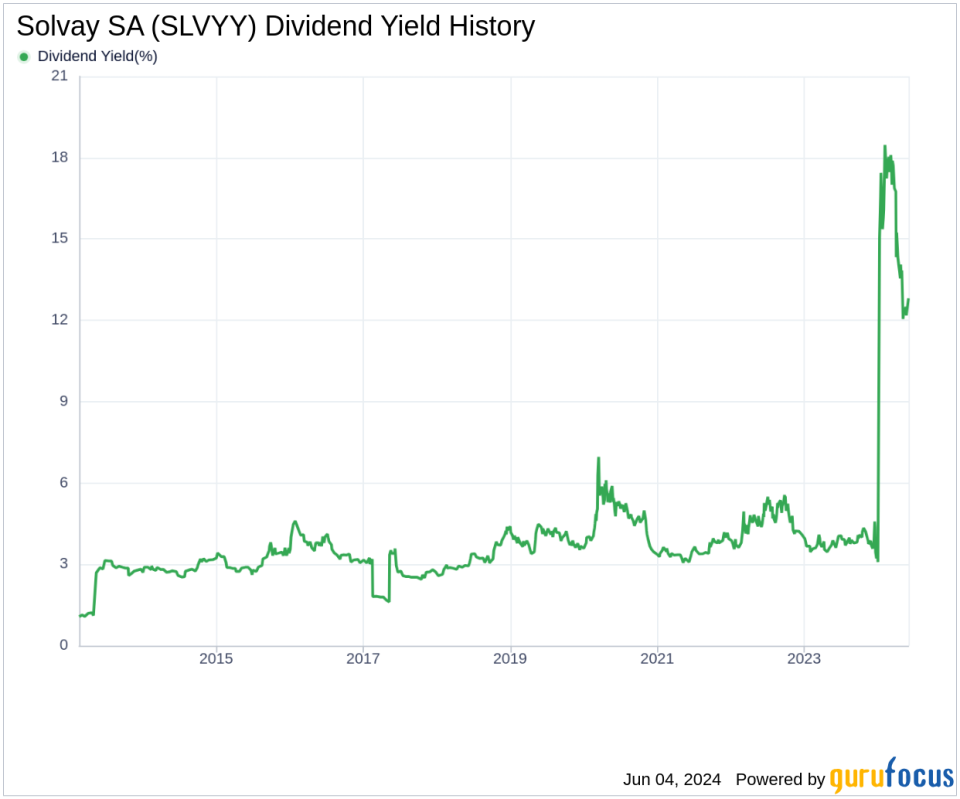
As of today, Solvay SA currently has a 12-month trailing dividend yield of 12.83% and a 12-month forward dividend yield of 7.58%. This suggests an expectation of decreased dividend payments over the next 12 months. Over the past three years, Solvay SA's annual dividend growth rate was 2.60%. Extended to a five-year horizon, this rate decreased to 1.90% per year. And over the past decade, Solvay SA's annual dividends per share growth rate stands at 3.00%.
Based on Solvay SA's dividend yield and five-year growth rate, the 5-year yield on cost of Solvay SA stock as of today is approximately 14.10%.
The Sustainability Question: Payout Ratio and Profitability
To assess the sustainability of the dividend, one needs to evaluate the company's payout ratio. The dividend payout ratio provides insights into the portion of earnings the company distributes as dividends. A lower ratio suggests that the company retains a significant part of its earnings, thereby ensuring the availability of funds for future growth and unexpected downturns. As of 2024-03-31, Solvay SA's dividend payout ratio is 0.83, which may suggest that the company's dividend may not be sustainable.
Solvay SA's profitability rank, offers an understanding of the company's earnings prowess relative to its peers. GuruFocus ranks Solvay SA's profitability 6 out of 10 as of 2024-03-31, suggesting fair profitability. The company has reported net profit in 9 years out of the past 10 years.
Growth Metrics: The Future Outlook
To ensure the sustainability of dividends, a company must have robust growth metrics. Solvay SA's growth rank of 6 out of 10 suggests that the company has a fair growth outlook. Revenue is the lifeblood of any company, and Solvay SA's revenue per share, combined with the 3-year revenue growth rate, indicates a strong revenue model. Solvay SA's revenue has increased by approximately -15.30% per year on average, a rate that underperforms approximately 94.28% of global competitors.
Conclusion: Assessing Solvay SA's Dividend Viability
The analysis of Solvay SA's dividend payments, growth rates, payout ratio, profitability, and growth metrics suggests a mixed picture. While the company maintains a strong dividend yield and has a history of consistent payments, the sustainability of these dividends could be challenged by the payout ratio and underperforming revenue growth. Investors should weigh these factors carefully. GuruFocus Premium users can further explore high-dividend yield opportunities using the High Dividend Yield Screener.
This article, generated by GuruFocus, is designed to provide general insights and is not tailored financial advice. Our commentary is rooted in historical data and analyst projections, utilizing an impartial methodology, and is not intended to serve as specific investment guidance. It does not formulate a recommendation to purchase or divest any stock and does not consider individual investment objectives or financial circumstances. Our objective is to deliver long-term, fundamental data-driven analysis. Be aware that our analysis might not incorporate the most recent, price-sensitive company announcements or qualitative information. GuruFocus holds no position in the stocks mentioned herein.
This article first appeared on GuruFocus.
