
 Yahoo Finance
 Slowing Rates Of Return At Excel Force MSC Berhad (KLSE:EFORCE) Leave Little Room For Excitement
What trends should we look for it we want to identify stocks that can multiply in value over the long term? Firstly, we'd want to identify a growing return on capital employed (ROCE) and then alongside that, an ever-increasing base of capital employed. If you see this, it typically means it's a company with a great business model and plenty of profitable reinvestment opportunities. That's why when we briefly looked at Excel Force MSC Berhad's (KLSE:EFORCE) ROCE trend, we were pretty happy with what we saw.
Understanding Return On Capital Employed (ROCE)
Just to clarify if you're unsure, ROCE is a metric for evaluating how much pre-tax income (in percentage terms) a company earns on the capital invested in its business. Analysts use this formula to calculate it for Excel Force MSC Berhad:
Return on Capital Employed = Earnings Before Interest and Tax (EBIT) ÷ (Total Assets - Current Liabilities)
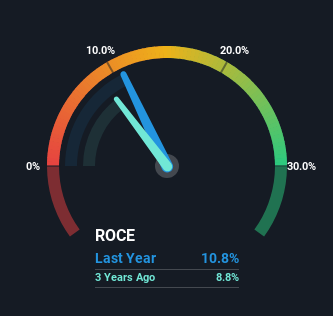
0.11 = RM11m ÷ (RM107m - RM7.8m) (Based on the trailing twelve months to June 2023).
Thus, Excel Force MSC Berhad has an ROCE of 11%. That's a pretty standard return and it's in line with the industry average of 11%.
View our latest analysis for Excel Force MSC Berhad
While the past is not representative of the future, it can be helpful to know how a company has performed historically, which is why we have this chart above. If you'd like to look at how Excel Force MSC Berhad has performed in the past in other metrics, you can view this free graph of Excel Force MSC Berhad's past earnings, revenue and cash flow.
What Does the ROCE Trend For Excel Force MSC Berhad Tell Us?
While the current returns on capital are decent, they haven't changed much. The company has consistently earned 11% for the last five years, and the capital employed within the business has risen 87% in that time. 11% is a pretty standard return, and it provides some comfort knowing that Excel Force MSC Berhad has consistently earned this amount. Stable returns in this ballpark can be unexciting, but if they can be maintained over the long run, they often provide nice rewards to shareholders.
What We Can Learn From Excel Force MSC Berhad's ROCE
To sum it up, Excel Force MSC Berhad has simply been reinvesting capital steadily, at those decent rates of return. And given the stock has only risen 17% over the last five years, we'd suspect the market is beginning to recognize these trends. That's why it could be worth your time looking into this stock further to discover if it has more traits of a multi-bagger.
If you'd like to know about the risks facing Excel Force MSC Berhad, we've discovered 4 warning signs that you should be aware of.
If you want to search for solid companies with great earnings, check out this free list of companies with good balance sheets and impressive returns on equity.
Have feedback on this article? Concerned about the content? Get in touch with us directly. Alternatively, email editorial-team (at) simplywallst.com.
This article by Simply Wall St is general in nature. We provide commentary based on historical data and analyst forecasts only using an unbiased methodology and our articles are not intended to be financial advice. It does not constitute a recommendation to buy or sell any stock, and does not take account of your objectives, or your financial situation. We aim to bring you long-term focused analysis driven by fundamental data. Note that our analysis may not factor in the latest price-sensitive company announcements or qualitative material. Simply Wall St has no position in any stocks mentioned.
