
 Yahoo Finance
 Slowing Rates Of Return At Chart Industries (NYSE:GTLS) Leave Little Room For Excitement
There are a few key trends to look for if we want to identify the next multi-bagger. Amongst other things, we'll want to see two things; firstly, a growing return on capital employed (ROCE) and secondly, an expansion in the company's amount of capital employed. Ultimately, this demonstrates that it's a business that is reinvesting profits at increasing rates of return. In light of that, when we looked at Chart Industries (NYSE:GTLS) and its ROCE trend, we weren't exactly thrilled.
What Is Return On Capital Employed (ROCE)?
If you haven't worked with ROCE before, it measures the 'return' (pre-tax profit) a company generates from capital employed in its business. The formula for this calculation on Chart Industries is:
Return on Capital Employed = Earnings Before Interest and Tax (EBIT) ÷ (Total Assets - Current Liabilities)
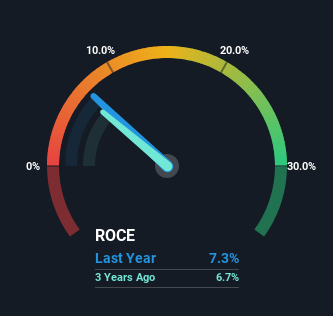
0.073 = US$534m ÷ (US$9.2b - US$1.9b) (Based on the trailing twelve months to March 2024).
Thus, Chart Industries has an ROCE of 7.3%. Ultimately, that's a low return and it under-performs the Machinery industry average of 13%.
View our latest analysis for Chart Industries
In the above chart we have measured Chart Industries' prior ROCE against its prior performance, but the future is arguably more important. If you're interested, you can view the analysts predictions in our free analyst report for Chart Industries .
What The Trend Of ROCE Can Tell Us
In terms of Chart Industries' historical ROCE trend, it doesn't exactly demand attention. The company has employed 451% more capital in the last five years, and the returns on that capital have remained stable at 7.3%. This poor ROCE doesn't inspire confidence right now, and with the increase in capital employed, it's evident that the business isn't deploying the funds into high return investments.
The Key Takeaway
As we've seen above, Chart Industries' returns on capital haven't increased but it is reinvesting in the business. Although the market must be expecting these trends to improve because the stock has gained 96% over the last five years. However, unless these underlying trends turn more positive, we wouldn't get our hopes up too high.
Chart Industries does come with some risks though, we found 3 warning signs in our investment analysis, and 1 of those is potentially serious...
For those who like to invest in solid companies, check out this free list of companies with solid balance sheets and high returns on equity.
Have feedback on this article? Concerned about the content? Get in touch with us directly. Alternatively, email editorial-team (at) simplywallst.com.
This article by Simply Wall St is general in nature. We provide commentary based on historical data and analyst forecasts only using an unbiased methodology and our articles are not intended to be financial advice. It does not constitute a recommendation to buy or sell any stock, and does not take account of your objectives, or your financial situation. We aim to bring you long-term focused analysis driven by fundamental data. Note that our analysis may not factor in the latest price-sensitive company announcements or qualitative material. Simply Wall St has no position in any stocks mentioned.
Have feedback on this article? Concerned about the content? Get in touch with us directly. Alternatively, email editorial-team@simplywallst.com
