
 Yahoo Finance
 Six Flags Entertainment (NYSE:SIX) sheds US$163m, company earnings and investor returns have been trending downwards for past five years
While it may not be enough for some shareholders, we think it is good to see the Six Flags Entertainment Corporation (NYSE:SIX) share price up 15% in a single quarter. But that doesn't change the fact that the returns over the last five years have been less than pleasing. After all, the share price is down 43% in that time, significantly under-performing the market.
If the past week is anything to go by, investor sentiment for Six Flags Entertainment isn't positive, so let's see if there's a mismatch between fundamentals and the share price.
View our latest analysis for Six Flags Entertainment
While markets are a powerful pricing mechanism, share prices reflect investor sentiment, not just underlying business performance. By comparing earnings per share (EPS) and share price changes over time, we can get a feel for how investor attitudes to a company have morphed over time.
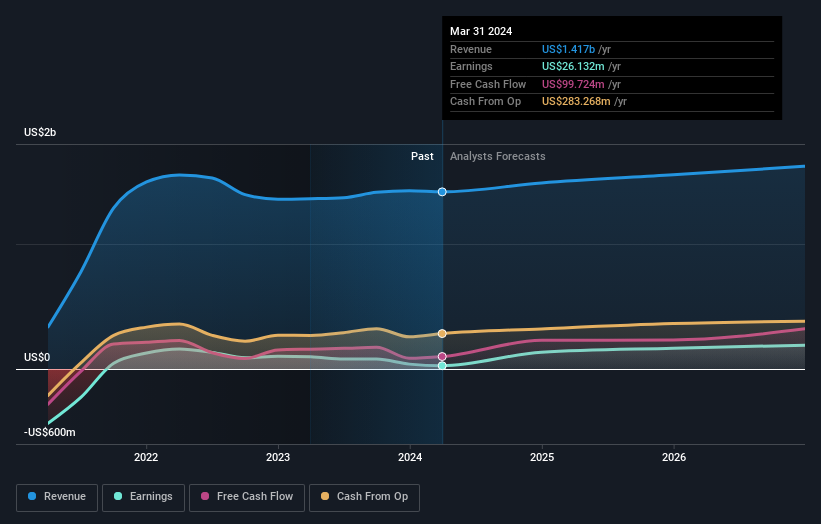
During five years of share price growth, Six Flags Entertainment moved from a loss to profitability. That would generally be considered a positive, so we are surprised to see the share price is down. Other metrics may better explain the share price move.
Revenue is actually up 3.7% over the time period. A more detailed examination of the revenue and earnings may or may not explain why the share price languishes; there could be an opportunity.
You can see below how earnings and revenue have changed over time (discover the exact values by clicking on the image).
Six Flags Entertainment is a well known stock, with plenty of analyst coverage, suggesting some visibility into future growth. You can see what analysts are predicting for Six Flags Entertainment in this interactive graph of future profit estimates.
What About The Total Shareholder Return (TSR)?
We'd be remiss not to mention the difference between Six Flags Entertainment's total shareholder return (TSR) and its share price return. The TSR is a return calculation that accounts for the value of cash dividends (assuming that any dividend received was reinvested) and the calculated value of any discounted capital raisings and spin-offs. Dividends have been really beneficial for Six Flags Entertainment shareholders, and that cash payout explains why its total shareholder loss of 40%, over the last 5 years, isn't as bad as the share price return.
A Different Perspective
Six Flags Entertainment provided a TSR of 15% over the last twelve months. Unfortunately this falls short of the market return. But at least that's still a gain! Over five years the TSR has been a reduction of 7% per year, over five years. So this might be a sign the business has turned its fortunes around. While it is well worth considering the different impacts that market conditions can have on the share price, there are other factors that are even more important. For example, we've discovered 4 warning signs for Six Flags Entertainment (2 shouldn't be ignored!) that you should be aware of before investing here.
For those who like to find winning investments this free list of undervalued companies with recent insider purchasing, could be just the ticket.
Please note, the market returns quoted in this article reflect the market weighted average returns of stocks that currently trade on American exchanges.
Have feedback on this article? Concerned about the content? Get in touch with us directly. Alternatively, email editorial-team (at) simplywallst.com.
This article by Simply Wall St is general in nature. We provide commentary based on historical data and analyst forecasts only using an unbiased methodology and our articles are not intended to be financial advice. It does not constitute a recommendation to buy or sell any stock, and does not take account of your objectives, or your financial situation. We aim to bring you long-term focused analysis driven by fundamental data. Note that our analysis may not factor in the latest price-sensitive company announcements or qualitative material. Simply Wall St has no position in any stocks mentioned.
Have feedback on this article? Concerned about the content? Get in touch with us directly. Alternatively, email editorial-team@simplywallst.com
