
 Yahoo Finance
 Sinopharm Group Co Ltd's Dividend Analysis
Exploring the Dividend Sustainability and Growth Prospects of Sinopharm Group Co Ltd (SHTDF)
Sinopharm Group Co Ltd (SHTDF) recently announced a dividend of $0.96 per share, payable on 2024-08-13, with the ex-dividend date set for 2024-06-17. As investors look forward to this upcoming payment, the spotlight also shines on the company's dividend history, yield, and growth rates. Using the data from GuruFocus, let's look into Sinopharm Group Co Ltd's dividend performance and assess its sustainability.
What Does Sinopharm Group Co Ltd Do?
This Powerful Chart Made Peter Lynch 29% A Year For 13 Years
How to calculate the intrinsic value of a stock?
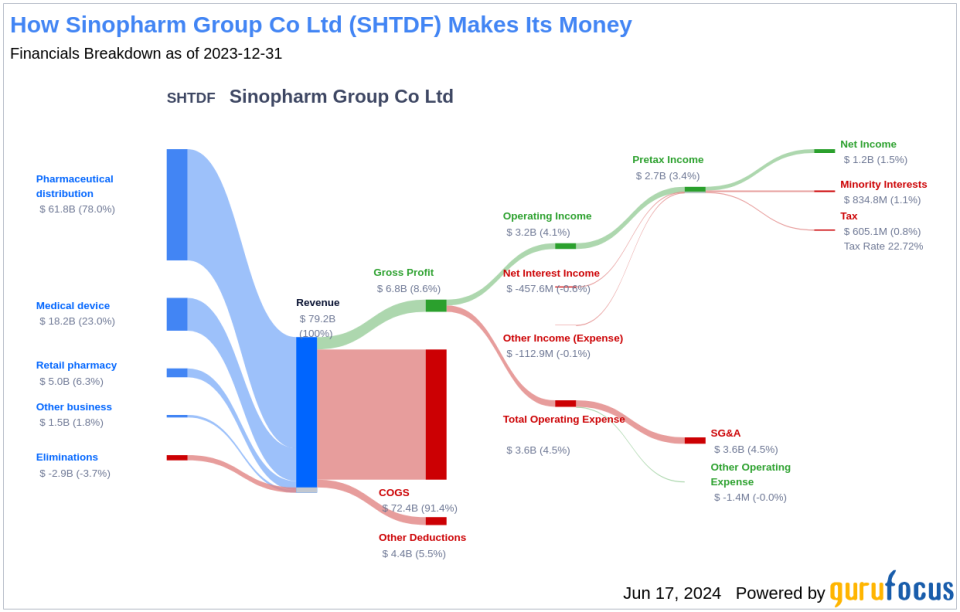
Founded in 2003, Sinopharm is the largest wholesaler and retailer of drugs and medical devices in China and listed on the Hong Kong Stock Exchange in 2009. It is a core subsidiary of China National Pharmaceutical Group. Sinopharm's largest operating segment is pharmaceutical distribution, making up over 70% of its total revenue by the end of 2023. In 2018, Sinopharm acquired the largest Chinese medical device distributor, China National Scientific Instruments and Materials. Now, medical device distribution accounts for over 20% of Sinopharm's total revenue. Sinopharm's downstream customers range from hospitals and other health services institutions to end-customers.
A Glimpse at Sinopharm Group Co Ltd's Dividend History
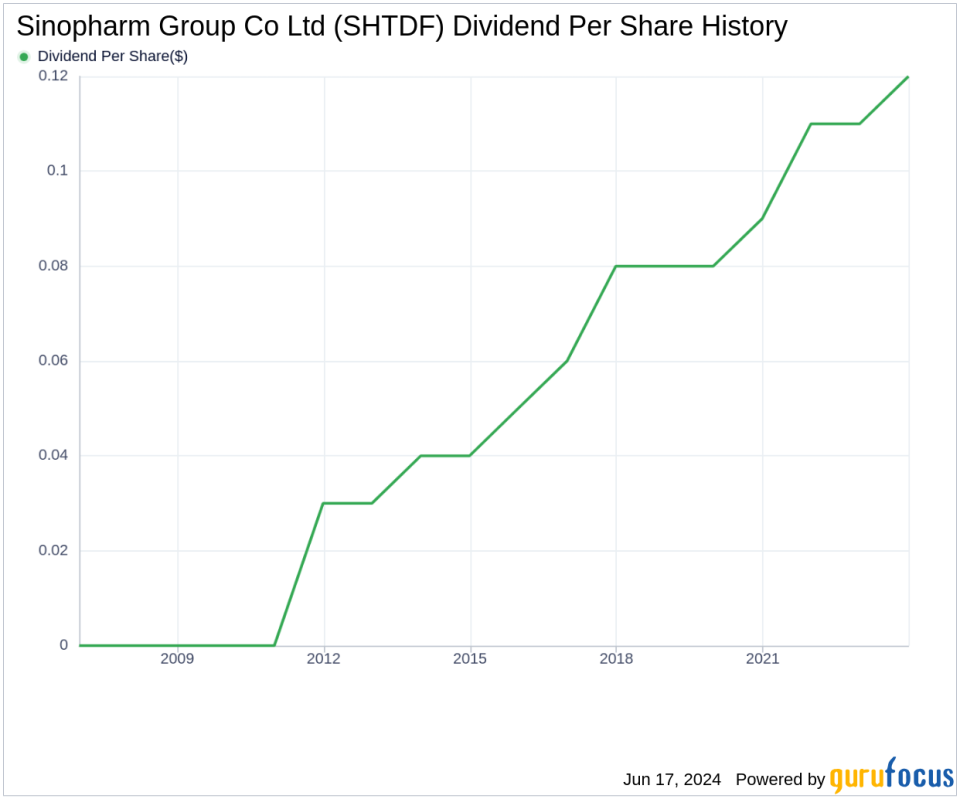
Sinopharm Group Co Ltd has maintained a consistent dividend payment record since 2011. Dividends are currently distributed on a yearly basis. Sinopharm Group Co Ltd has increased its dividend each year since 2011. The stock is thus listed as a dividend achiever, an honor that is given to companies that have increased their dividend each year for at least the past 13 years.
Breaking Down Sinopharm Group Co Ltd's Dividend Yield and Growth
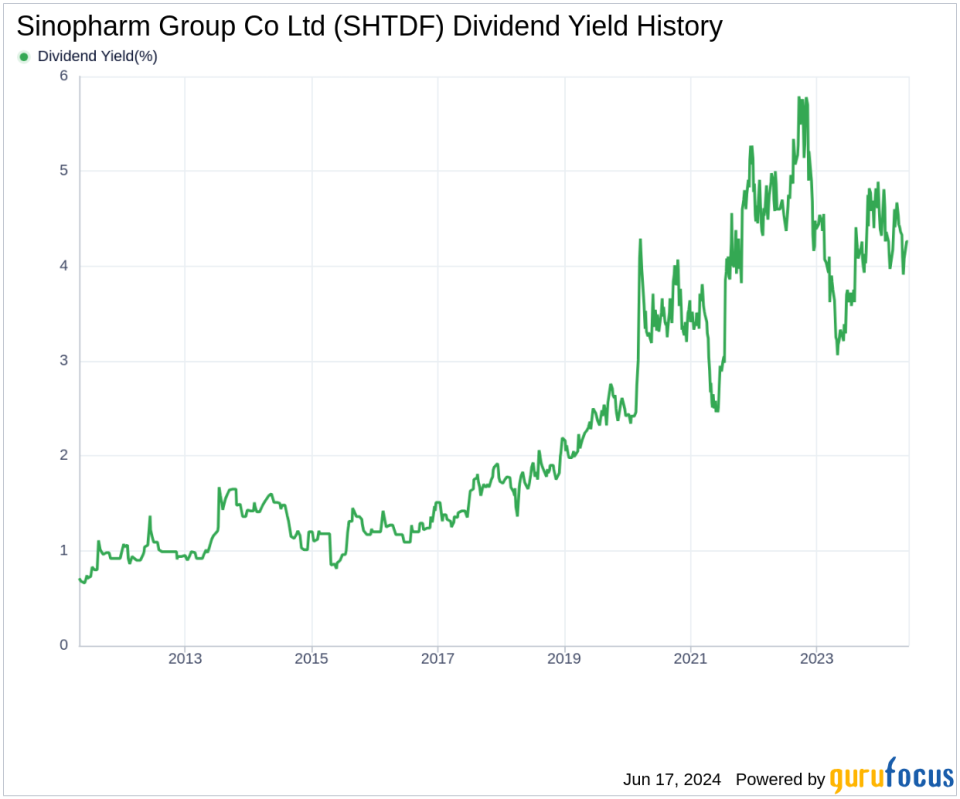
As of today, Sinopharm Group Co Ltd currently has a 12-month trailing dividend yield of 4.27% and a 12-month forward dividend yield of 4.53%. This suggests an expectation of increased dividend payments over the next 12 months. Over the past three years, Sinopharm Group Co Ltd's annual dividend growth rate was 8.90%. Extended to a five-year horizon, this rate decreased to 7.50% per year. And over the past decade, Sinopharm Group Co Ltd's annual dividends per share growth rate stands at an impressive 11.90%.
The Sustainability Question: Payout Ratio and Profitability
To assess the sustainability of the dividend, one needs to evaluate the company's payout ratio. The dividend payout ratio provides insights into the portion of earnings the company distributes as dividends. A lower ratio suggests that the company retains a significant part of its earnings, thereby ensuring the availability of funds for future growth and unexpected downturns. As of 2024-03-31, Sinopharm Group Co Ltd's dividend payout ratio is 0.28.
Sinopharm Group Co Ltd's profitability rank, offers an understanding of the company's earnings prowess relative to its peers. GuruFocus ranks Sinopharm Group Co Ltd's profitability 9 out of 10 as of 2024-03-31, suggesting good profitability prospects. The company has reported positive net income for each year over the past decade, further solidifying its high profitability.
Growth Metrics: The Future Outlook
To ensure the sustainability of dividends, a company must have robust growth metrics. Sinopharm Group Co Ltd's growth rank of 9 out of 10 suggests that the company's growth trajectory is good relative to its competitors. The company's revenue per share, combined with the 3-year revenue growth rate, indicates a strong revenue model. Sinopharm Group Co Ltd's revenue has increased by approximately 6.30% per year on average, a rate that underperforms approximately 56.99% of global competitors. The company's 3-year EPS growth rate showcases its capability to grow its earnings, a critical component for sustaining dividends in the long run. During the past three years, Sinopharm Group Co Ltd's earnings increased by approximately 1.70% per year on average, a rate that underperforms approximately 60.98% of global competitors. Lastly, the company's 5-year EBITDA growth rate of 5.80%, which underperforms approximately 53.23% of global competitors.
Conclusion
Considering Sinopharm Group Co Ltd's consistent dividend increases, moderate payout ratio, and strong profitability, the dividend appears sustainable in the near term. However, the company's growth metrics, while solid, suggest potential areas for improvement to maintain its dividend growth trajectory. Investors should monitor these growth indicators closely to gauge future dividend sustainability. For those interested in exploring further, GuruFocus Premium users can screen for high-dividend yield stocks using the High Dividend Yield Screener.
This article, generated by GuruFocus, is designed to provide general insights and is not tailored financial advice. Our commentary is rooted in historical data and analyst projections, utilizing an impartial methodology, and is not intended to serve as specific investment guidance. It does not formulate a recommendation to purchase or divest any stock and does not consider individual investment objectives or financial circumstances. Our objective is to deliver long-term, fundamental data-driven analysis. Be aware that our analysis might not incorporate the most recent, price-sensitive company announcements or qualitative information. GuruFocus holds no position in the stocks mentioned herein.
This article first appeared on GuruFocus.
