
 Yahoo Finance
 SIA Engineering's (SGX:S59) Returns On Capital Not Reflecting Well On The Business
If you're looking at a mature business that's past the growth phase, what are some of the underlying trends that pop up? Businesses in decline often have two underlying trends, firstly, a declining return on capital employed (ROCE) and a declining base of capital employed. This indicates to us that the business is not only shrinking the size of its net assets, but its returns are falling as well. And from a first read, things don't look too good at SIA Engineering (SGX:S59), so let's see why.
Understanding Return On Capital Employed (ROCE)
Just to clarify if you're unsure, ROCE is a metric for evaluating how much pre-tax income (in percentage terms) a company earns on the capital invested in its business. To calculate this metric for SIA Engineering, this is the formula:
Return on Capital Employed = Earnings Before Interest and Tax (EBIT) ÷ (Total Assets - Current Liabilities)
0.00099 = S$1.8m ÷ (S$2.1b - S$302m) (Based on the trailing twelve months to March 2024).
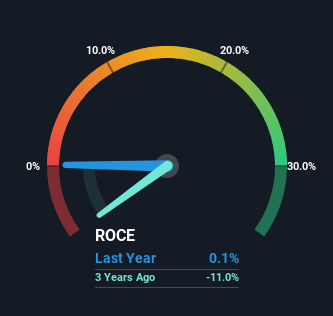
Therefore, SIA Engineering has an ROCE of 0.1%. In absolute terms, that's a low return and it also under-performs the Infrastructure industry average of 6.6%.
View our latest analysis for SIA Engineering
In the above chart we have measured SIA Engineering's prior ROCE against its prior performance, but the future is arguably more important. If you're interested, you can view the analysts predictions in our free analyst report for SIA Engineering .
So How Is SIA Engineering's ROCE Trending?
In terms of SIA Engineering's historical ROCE movements, the trend doesn't inspire confidence. About five years ago, returns on capital were 3.6%, however they're now substantially lower than that as we saw above. Meanwhile, capital employed in the business has stayed roughly the flat over the period. Since returns are falling and the business has the same amount of assets employed, this can suggest it's a mature business that hasn't had much growth in the last five years. So because these trends aren't typically conducive to creating a multi-bagger, we wouldn't hold our breath on SIA Engineering becoming one if things continue as they have.
The Bottom Line On SIA Engineering's ROCE
All in all, the lower returns from the same amount of capital employed aren't exactly signs of a compounding machine. Investors must expect better things on the horizon though because the stock has risen 2.7% in the last five years. Regardless, we don't like the trends as they are and if they persist, we think you might find better investments elsewhere.
On a separate note, we've found 1 warning sign for SIA Engineering you'll probably want to know about.
For those who like to invest in solid companies, check out this free list of companies with solid balance sheets and high returns on equity.
Have feedback on this article? Concerned about the content? Get in touch with us directly. Alternatively, email editorial-team (at) simplywallst.com.
This article by Simply Wall St is general in nature. We provide commentary based on historical data and analyst forecasts only using an unbiased methodology and our articles are not intended to be financial advice. It does not constitute a recommendation to buy or sell any stock, and does not take account of your objectives, or your financial situation. We aim to bring you long-term focused analysis driven by fundamental data. Note that our analysis may not factor in the latest price-sensitive company announcements or qualitative material. Simply Wall St has no position in any stocks mentioned.
Have feedback on this article? Concerned about the content? Get in touch with us directly. Alternatively, email editorial-team@simplywallst.com
