
 Yahoo Finance
 SHH Resources Holdings Berhad (KLSE:SHH) Is Experiencing Growth In Returns On Capital
To find a multi-bagger stock, what are the underlying trends we should look for in a business? Typically, we'll want to notice a trend of growing return on capital employed (ROCE) and alongside that, an expanding base of capital employed. This shows us that it's a compounding machine, able to continually reinvest its earnings back into the business and generate higher returns. Speaking of which, we noticed some great changes in SHH Resources Holdings Berhad's (KLSE:SHH) returns on capital, so let's have a look.
Understanding Return On Capital Employed (ROCE)
For those who don't know, ROCE is a measure of a company's yearly pre-tax profit (its return), relative to the capital employed in the business. The formula for this calculation on SHH Resources Holdings Berhad is:
Return on Capital Employed = Earnings Before Interest and Tax (EBIT) ÷ (Total Assets - Current Liabilities)
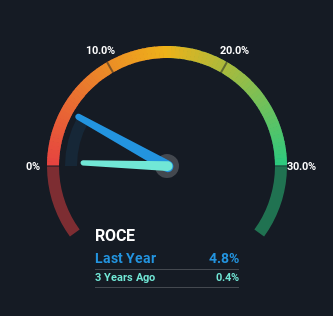
0.048 = RM4.2m ÷ (RM104m - RM18m) (Based on the trailing twelve months to December 2023).
Therefore, SHH Resources Holdings Berhad has an ROCE of 4.8%. Ultimately, that's a low return and it under-performs the Consumer Durables industry average of 11%.
View our latest analysis for SHH Resources Holdings Berhad
While the past is not representative of the future, it can be helpful to know how a company has performed historically, which is why we have this chart above. If you're interested in investigating SHH Resources Holdings Berhad's past further, check out this free graph covering SHH Resources Holdings Berhad's past earnings, revenue and cash flow.
So How Is SHH Resources Holdings Berhad's ROCE Trending?
SHH Resources Holdings Berhad has broken into the black (profitability) and we're sure it's a sight for sore eyes. The company now earns 4.8% on its capital, because five years ago it was incurring losses. On top of that, what's interesting is that the amount of capital being employed has remained steady, so the business hasn't needed to put any additional money to work to generate these higher returns. With no noticeable increase in capital employed, it's worth knowing what the company plans on doing going forward in regards to reinvesting and growing the business. So if you're looking for high growth, you'll want to see a business's capital employed also increasing.
The Bottom Line
As discussed above, SHH Resources Holdings Berhad appears to be getting more proficient at generating returns since capital employed has remained flat but earnings (before interest and tax) are up. And a remarkable 457% total return over the last five years tells us that investors are expecting more good things to come in the future. So given the stock has proven it has promising trends, it's worth researching the company further to see if these trends are likely to persist.
On a final note, we've found 3 warning signs for SHH Resources Holdings Berhad that we think you should be aware of.
While SHH Resources Holdings Berhad isn't earning the highest return, check out this free list of companies that are earning high returns on equity with solid balance sheets.
Have feedback on this article? Concerned about the content? Get in touch with us directly. Alternatively, email editorial-team (at) simplywallst.com.
This article by Simply Wall St is general in nature. We provide commentary based on historical data and analyst forecasts only using an unbiased methodology and our articles are not intended to be financial advice. It does not constitute a recommendation to buy or sell any stock, and does not take account of your objectives, or your financial situation. We aim to bring you long-term focused analysis driven by fundamental data. Note that our analysis may not factor in the latest price-sensitive company announcements or qualitative material. Simply Wall St has no position in any stocks mentioned.
