
 Yahoo Finance
 Shareholders in Perpetual (ASX:PPT) are in the red if they invested five years ago
In order to justify the effort of selecting individual stocks, it's worth striving to beat the returns from a market index fund. But even the best stock picker will only win with some selections. So we wouldn't blame long term Perpetual Limited (ASX:PPT) shareholders for doubting their decision to hold, with the stock down 46% over a half decade. Shareholders have had an even rougher run lately, with the share price down 11% in the last 90 days.
So let's have a look and see if the longer term performance of the company has been in line with the underlying business' progress.
View our latest analysis for Perpetual
While the efficient markets hypothesis continues to be taught by some, it has been proven that markets are over-reactive dynamic systems, and investors are not always rational. One way to examine how market sentiment has changed over time is to look at the interaction between a company's share price and its earnings per share (EPS).
During the five years over which the share price declined, Perpetual's earnings per share (EPS) dropped by 27% each year. This fall in the EPS is worse than the 12% compound annual share price fall. The relatively muted share price reaction might be because the market expects the business to turn around.
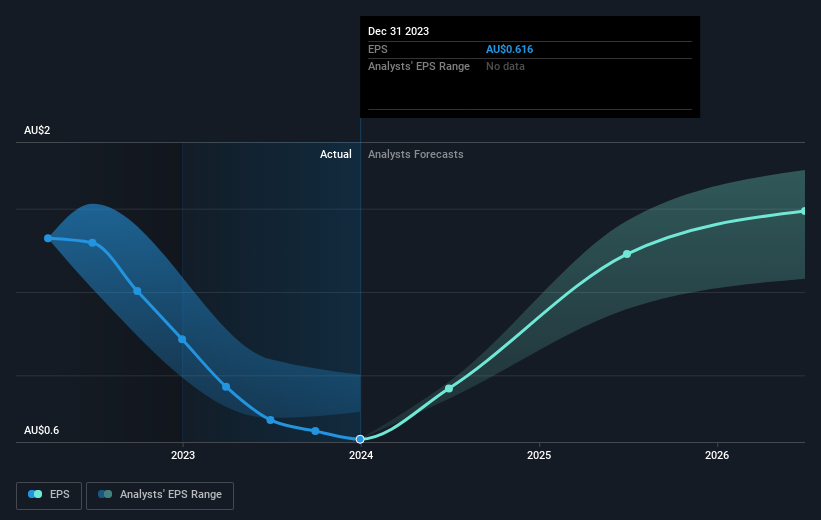
The company's earnings per share (over time) is depicted in the image below (click to see the exact numbers).
It might be well worthwhile taking a look at our free report on Perpetual's earnings, revenue and cash flow.
What About Dividends?
It is important to consider the total shareholder return, as well as the share price return, for any given stock. Whereas the share price return only reflects the change in the share price, the TSR includes the value of dividends (assuming they were reinvested) and the benefit of any discounted capital raising or spin-off. Arguably, the TSR gives a more comprehensive picture of the return generated by a stock. As it happens, Perpetual's TSR for the last 5 years was -28%, which exceeds the share price return mentioned earlier. This is largely a result of its dividend payments!
A Different Perspective
While the broader market gained around 13% in the last year, Perpetual shareholders lost 6.1% (even including dividends). Even the share prices of good stocks drop sometimes, but we want to see improvements in the fundamental metrics of a business, before getting too interested. However, the loss over the last year isn't as bad as the 5% per annum loss investors have suffered over the last half decade. We would want clear information suggesting the company will grow, before taking the view that the share price will stabilize. It's always interesting to track share price performance over the longer term. But to understand Perpetual better, we need to consider many other factors. To that end, you should be aware of the 2 warning signs we've spotted with Perpetual .
If you like to buy stocks alongside management, then you might just love this free list of companies. (Hint: many of them are unnoticed AND have attractive valuation).
Please note, the market returns quoted in this article reflect the market weighted average returns of stocks that currently trade on Australian exchanges.
Have feedback on this article? Concerned about the content? Get in touch with us directly. Alternatively, email editorial-team (at) simplywallst.com.
This article by Simply Wall St is general in nature. We provide commentary based on historical data and analyst forecasts only using an unbiased methodology and our articles are not intended to be financial advice. It does not constitute a recommendation to buy or sell any stock, and does not take account of your objectives, or your financial situation. We aim to bring you long-term focused analysis driven by fundamental data. Note that our analysis may not factor in the latest price-sensitive company announcements or qualitative material. Simply Wall St has no position in any stocks mentioned.
