
 Yahoo Finance
 Shareholders Are Optimistic That CGI (TSE:GIB.A) Will Multiply In Value
Finding a business that has the potential to grow substantially is not easy, but it is possible if we look at a few key financial metrics. Ideally, a business will show two trends; firstly a growing return on capital employed (ROCE) and secondly, an increasing amount of capital employed. Basically this means that a company has profitable initiatives that it can continue to reinvest in, which is a trait of a compounding machine. So, when we ran our eye over CGI's (TSE:GIB.A) trend of ROCE, we really liked what we saw.
What Is Return On Capital Employed (ROCE)?
If you haven't worked with ROCE before, it measures the 'return' (pre-tax profit) a company generates from capital employed in its business. Analysts use this formula to calculate it for CGI:
Return on Capital Employed = Earnings Before Interest and Tax (EBIT) ÷ (Total Assets - Current Liabilities)
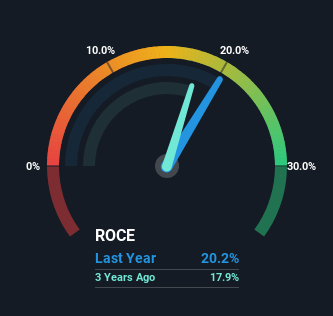
0.20 = CA$2.4b ÷ (CA$16b - CA$4.0b) (Based on the trailing twelve months to March 2024).
Therefore, CGI has an ROCE of 20%. That's a fantastic return and not only that, it outpaces the average of 11% earned by companies in a similar industry.
View our latest analysis for CGI
In the above chart we have measured CGI's prior ROCE against its prior performance, but the future is arguably more important. If you'd like, you can check out the forecasts from the analysts covering CGI for free.
The Trend Of ROCE
CGI deserves to be commended in regards to it's returns. The company has consistently earned 20% for the last five years, and the capital employed within the business has risen 22% in that time. Returns like this are the envy of most businesses and given it has repeatedly reinvested at these rates, that's even better. If CGI can keep this up, we'd be very optimistic about its future.
In Conclusion...
In summary, we're delighted to see that CGI has been compounding returns by reinvesting at consistently high rates of return, as these are common traits of a multi-bagger. In light of this, the stock has only gained 34% over the last five years for shareholders who have owned the stock in this period. That's why it could be worth your time looking into this stock further to discover if it has more traits of a multi-bagger.
On the other side of ROCE, we have to consider valuation. That's why we have a FREE intrinsic value estimation for GIB.A on our platform that is definitely worth checking out.
CGI is not the only stock earning high returns. If you'd like to see more, check out our free list of companies earning high returns on equity with solid fundamentals.
Have feedback on this article? Concerned about the content? Get in touch with us directly. Alternatively, email editorial-team (at) simplywallst.com.
This article by Simply Wall St is general in nature. We provide commentary based on historical data and analyst forecasts only using an unbiased methodology and our articles are not intended to be financial advice. It does not constitute a recommendation to buy or sell any stock, and does not take account of your objectives, or your financial situation. We aim to bring you long-term focused analysis driven by fundamental data. Note that our analysis may not factor in the latest price-sensitive company announcements or qualitative material. Simply Wall St has no position in any stocks mentioned.
Have feedback on this article? Concerned about the content? Get in touch with us directly. Alternatively, email editorial-team@simplywallst.com