
 Yahoo Finance
 Shareholders in OPENLANE (NYSE:KAR) are in the red if they invested five years ago
The main aim of stock picking is to find the market-beating stocks. But every investor is virtually certain to have both over-performing and under-performing stocks. So we wouldn't blame long term OPENLANE, Inc. (NYSE:KAR) shareholders for doubting their decision to hold, with the stock down 73% over a half decade.
With that in mind, it's worth seeing if the company's underlying fundamentals have been the driver of long term performance, or if there are some discrepancies.
View our latest analysis for OPENLANE
OPENLANE isn't currently profitable, so most analysts would look to revenue growth to get an idea of how fast the underlying business is growing. Generally speaking, companies without profits are expected to grow revenue every year, and at a good clip. That's because it's hard to be confident a company will be sustainable if revenue growth is negligible, and it never makes a profit.
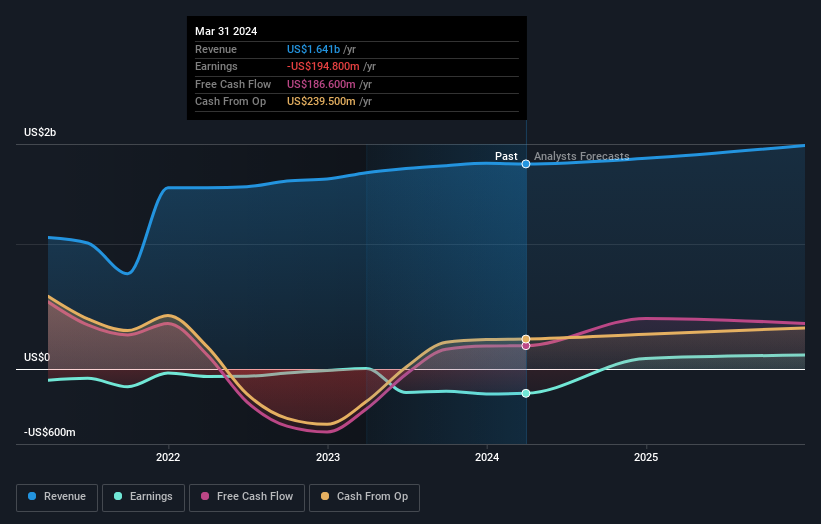
Over half a decade OPENLANE reduced its trailing twelve month revenue by 14% for each year. That's definitely a weaker result than most pre-profit companies report. So it's not altogether surprising to see the share price down 12% per year in the same time period. This kind of price performance makes us very wary, especially when combined with falling revenue. Ironically, that behavior could create an opportunity for the contrarian investor - but only if there are good reasons to predict a brighter future.
The graphic below depicts how earnings and revenue have changed over time (unveil the exact values by clicking on the image).
We like that insiders have been buying shares in the last twelve months. Even so, future earnings will be far more important to whether current shareholders make money. You can see what analysts are predicting for OPENLANE in this interactive graph of future profit estimates.
What About The Total Shareholder Return (TSR)?
We've already covered OPENLANE's share price action, but we should also mention its total shareholder return (TSR). Arguably the TSR is a more complete return calculation because it accounts for the value of dividends (as if they were reinvested), along with the hypothetical value of any discounted capital that have been offered to shareholders. OPENLANE's TSR of was a loss of 28% for the 5 years. That wasn't as bad as its share price return, because it has paid dividends.
A Different Perspective
OPENLANE provided a TSR of 9.3% over the last twelve months. But that return falls short of the market. On the bright side, that's still a gain, and it is certainly better than the yearly loss of about 5% endured over half a decade. It could well be that the business is stabilizing. It's always interesting to track share price performance over the longer term. But to understand OPENLANE better, we need to consider many other factors. Case in point: We've spotted 1 warning sign for OPENLANE you should be aware of.
There are plenty of other companies that have insiders buying up shares. You probably do not want to miss this free list of undervalued small cap companies that insiders are buying.
Please note, the market returns quoted in this article reflect the market weighted average returns of stocks that currently trade on American exchanges.
Have feedback on this article? Concerned about the content? Get in touch with us directly. Alternatively, email editorial-team (at) simplywallst.com.
This article by Simply Wall St is general in nature. We provide commentary based on historical data and analyst forecasts only using an unbiased methodology and our articles are not intended to be financial advice. It does not constitute a recommendation to buy or sell any stock, and does not take account of your objectives, or your financial situation. We aim to bring you long-term focused analysis driven by fundamental data. Note that our analysis may not factor in the latest price-sensitive company announcements or qualitative material. Simply Wall St has no position in any stocks mentioned.
Have feedback on this article? Concerned about the content? Get in touch with us directly. Alternatively, email editorial-team@simplywallst.com
