
 Yahoo Finance
 SFS Group (VTX:SFSN) Has More To Do To Multiply In Value Going Forward
There are a few key trends to look for if we want to identify the next multi-bagger. Firstly, we'd want to identify a growing return on capital employed (ROCE) and then alongside that, an ever-increasing base of capital employed. If you see this, it typically means it's a company with a great business model and plenty of profitable reinvestment opportunities. That's why when we briefly looked at SFS Group's (VTX:SFSN) ROCE trend, we were pretty happy with what we saw.
Understanding Return On Capital Employed (ROCE)
If you haven't worked with ROCE before, it measures the 'return' (pre-tax profit) a company generates from capital employed in its business. Analysts use this formula to calculate it for SFS Group:
Return on Capital Employed = Earnings Before Interest and Tax (EBIT) ÷ (Total Assets - Current Liabilities)
0.17 = CHF355m ÷ (CHF2.5b - CHF441m) (Based on the trailing twelve months to December 2023).
Thus, SFS Group has an ROCE of 17%. That's a relatively normal return on capital, and it's around the 15% generated by the Machinery industry.
Check out our latest analysis for SFS Group
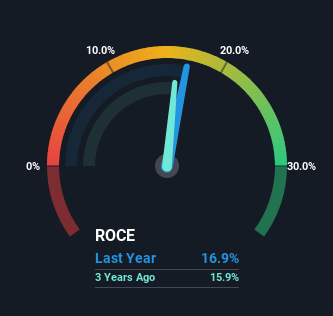
Above you can see how the current ROCE for SFS Group compares to its prior returns on capital, but there's only so much you can tell from the past. If you'd like to see what analysts are forecasting going forward, you should check out our free analyst report for SFS Group .
How Are Returns Trending?
While the current returns on capital are decent, they haven't changed much. The company has consistently earned 17% for the last five years, and the capital employed within the business has risen 58% in that time. Since 17% is a moderate ROCE though, it's good to see a business can continue to reinvest at these decent rates of return. Stable returns in this ballpark can be unexciting, but if they can be maintained over the long run, they often provide nice rewards to shareholders.
Our Take On SFS Group's ROCE
The main thing to remember is that SFS Group has proven its ability to continually reinvest at respectable rates of return. Therefore it's no surprise that shareholders have earned a respectable 78% return if they held over the last five years. So even though the stock might be more "expensive" than it was before, we think the strong fundamentals warrant this stock for further research.
SFS Group does have some risks though, and we've spotted 1 warning sign for SFS Group that you might be interested in.
While SFS Group isn't earning the highest return, check out this free list of companies that are earning high returns on equity with solid balance sheets.
Have feedback on this article? Concerned about the content? Get in touch with us directly. Alternatively, email editorial-team (at) simplywallst.com.
This article by Simply Wall St is general in nature. We provide commentary based on historical data and analyst forecasts only using an unbiased methodology and our articles are not intended to be financial advice. It does not constitute a recommendation to buy or sell any stock, and does not take account of your objectives, or your financial situation. We aim to bring you long-term focused analysis driven by fundamental data. Note that our analysis may not factor in the latest price-sensitive company announcements or qualitative material. Simply Wall St has no position in any stocks mentioned.
