
 Yahoo Finance
 ON Semiconductor's (NASDAQ:ON) 30% CAGR outpaced the company's earnings growth over the same five-year period
The most you can lose on any stock (assuming you don't use leverage) is 100% of your money. But on a lighter note, a good company can see its share price rise well over 100%. For example, the ON Semiconductor Corporation (NASDAQ:ON) share price has soared 269% in the last half decade. Most would be very happy with that. And in the last week the share price has popped 6.6%.
The past week has proven to be lucrative for ON Semiconductor investors, so let's see if fundamentals drove the company's five-year performance.
View our latest analysis for ON Semiconductor
While the efficient markets hypothesis continues to be taught by some, it has been proven that markets are over-reactive dynamic systems, and investors are not always rational. One imperfect but simple way to consider how the market perception of a company has shifted is to compare the change in the earnings per share (EPS) with the share price movement.
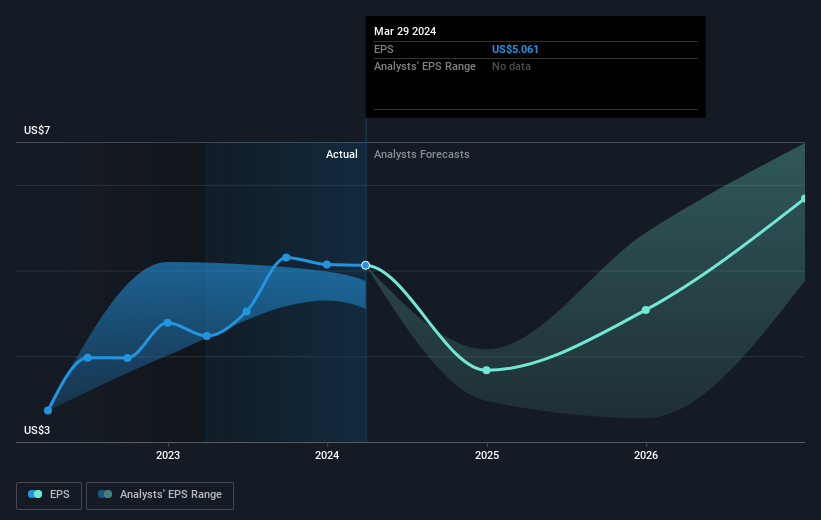
Over half a decade, ON Semiconductor managed to grow its earnings per share at 29% a year. That makes the EPS growth particularly close to the yearly share price growth of 30%. Therefore one could conclude that sentiment towards the shares hasn't morphed very much. Rather, the share price has approximately tracked EPS growth.
You can see below how EPS has changed over time (discover the exact values by clicking on the image).
It is of course excellent to see how ON Semiconductor has grown profits over the years, but the future is more important for shareholders. Take a more thorough look at ON Semiconductor's financial health with this free report on its balance sheet.
A Different Perspective
ON Semiconductor shareholders are down 22% for the year, but the market itself is up 25%. However, keep in mind that even the best stocks will sometimes underperform the market over a twelve month period. Longer term investors wouldn't be so upset, since they would have made 30%, each year, over five years. It could be that the recent sell-off is an opportunity, so it may be worth checking the fundamental data for signs of a long term growth trend. While it is well worth considering the different impacts that market conditions can have on the share price, there are other factors that are even more important. For instance, we've identified 1 warning sign for ON Semiconductor that you should be aware of.
Of course ON Semiconductor may not be the best stock to buy. So you may wish to see this free collection of growth stocks.
Please note, the market returns quoted in this article reflect the market weighted average returns of stocks that currently trade on American exchanges.
Have feedback on this article? Concerned about the content? Get in touch with us directly. Alternatively, email editorial-team (at) simplywallst.com.
This article by Simply Wall St is general in nature. We provide commentary based on historical data and analyst forecasts only using an unbiased methodology and our articles are not intended to be financial advice. It does not constitute a recommendation to buy or sell any stock, and does not take account of your objectives, or your financial situation. We aim to bring you long-term focused analysis driven by fundamental data. Note that our analysis may not factor in the latest price-sensitive company announcements or qualitative material. Simply Wall St has no position in any stocks mentioned.
Have feedback on this article? Concerned about the content? Get in touch with us directly. Alternatively, email editorial-team@simplywallst.com
