
 Yahoo Finance
 Scully Royalty (NYSE:SRL) investors are sitting on a loss of 39% if they invested three years ago
Scully Royalty Ltd. (NYSE:SRL) shareholders should be happy to see the share price up 13% in the last month. But that doesn't change the fact that the returns over the last three years have been less than pleasing. In fact, the share price is down 46% in the last three years, falling well short of the market return.
Since shareholders are down over the longer term, lets look at the underlying fundamentals over the that time and see if they've been consistent with returns.
See our latest analysis for Scully Royalty
While the efficient markets hypothesis continues to be taught by some, it has been proven that markets are over-reactive dynamic systems, and investors are not always rational. One imperfect but simple way to consider how the market perception of a company has shifted is to compare the change in the earnings per share (EPS) with the share price movement.
Scully Royalty became profitable within the last five years. We would usually expect to see the share price rise as a result. So given the share price is down it's worth checking some other metrics too.
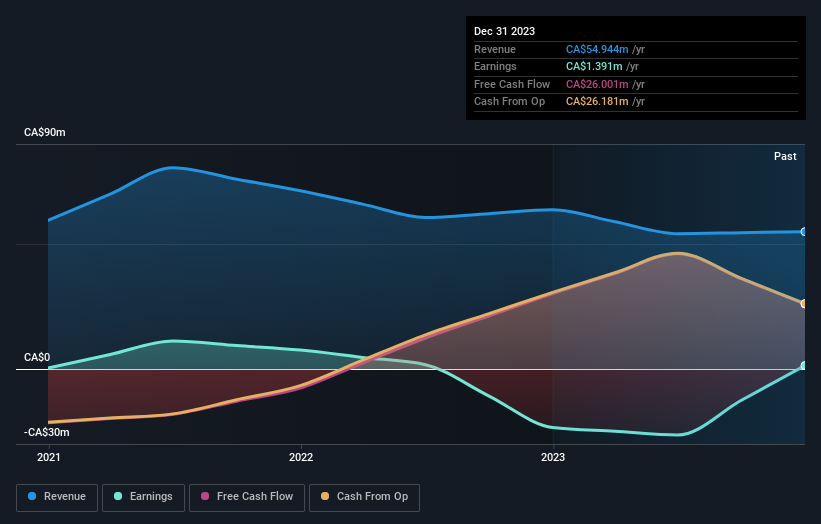
We think that the revenue decline over three years, at a rate of 9.6% per year, probably had some shareholders looking to sell. After all, if revenue keeps shrinking, it may be difficult to find earnings growth in the future.
The company's revenue and earnings (over time) are depicted in the image below (click to see the exact numbers).
This free interactive report on Scully Royalty's balance sheet strength is a great place to start, if you want to investigate the stock further.
What About The Total Shareholder Return (TSR)?
We'd be remiss not to mention the difference between Scully Royalty's total shareholder return (TSR) and its share price return. The TSR attempts to capture the value of dividends (as if they were reinvested) as well as any spin-offs or discounted capital raisings offered to shareholders. Its history of dividend payouts mean that Scully Royalty's TSR, which was a 39% drop over the last 3 years, was not as bad as the share price return.
A Different Perspective
Scully Royalty shareholders gained a total return of 0.6% during the year. But that return falls short of the market. On the bright side, that's still a gain, and it is certainly better than the yearly loss of about 5% endured over half a decade. It could well be that the business is stabilizing. It's always interesting to track share price performance over the longer term. But to understand Scully Royalty better, we need to consider many other factors. For example, we've discovered 2 warning signs for Scully Royalty that you should be aware of before investing here.
If you would prefer to check out another company -- one with potentially superior financials -- then do not miss this free list of companies that have proven they can grow earnings.
Please note, the market returns quoted in this article reflect the market weighted average returns of stocks that currently trade on American exchanges.
Have feedback on this article? Concerned about the content? Get in touch with us directly. Alternatively, email editorial-team (at) simplywallst.com.
This article by Simply Wall St is general in nature. We provide commentary based on historical data and analyst forecasts only using an unbiased methodology and our articles are not intended to be financial advice. It does not constitute a recommendation to buy or sell any stock, and does not take account of your objectives, or your financial situation. We aim to bring you long-term focused analysis driven by fundamental data. Note that our analysis may not factor in the latest price-sensitive company announcements or qualitative material. Simply Wall St has no position in any stocks mentioned.
