
 Yahoo Finance
 Scicom (MSC) Berhad (KLSE:SCICOM) Looks To Prolong Its Impressive Returns
If you're not sure where to start when looking for the next multi-bagger, there are a few key trends you should keep an eye out for. Firstly, we'll want to see a proven return on capital employed (ROCE) that is increasing, and secondly, an expanding base of capital employed. If you see this, it typically means it's a company with a great business model and plenty of profitable reinvestment opportunities. With that in mind, the ROCE of Scicom (MSC) Berhad (KLSE:SCICOM) looks attractive right now, so lets see what the trend of returns can tell us.
Return On Capital Employed (ROCE): What Is It?
Just to clarify if you're unsure, ROCE is a metric for evaluating how much pre-tax income (in percentage terms) a company earns on the capital invested in its business. To calculate this metric for Scicom (MSC) Berhad, this is the formula:
Return on Capital Employed = Earnings Before Interest and Tax (EBIT) ÷ (Total Assets - Current Liabilities)
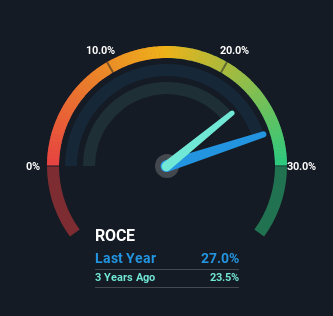
0.27 = RM36m ÷ (RM159m - RM25m) (Based on the trailing twelve months to March 2024).
So, Scicom (MSC) Berhad has an ROCE of 27%. In absolute terms that's a great return and it's even better than the Professional Services industry average of 13%.
Check out our latest analysis for Scicom (MSC) Berhad
Above you can see how the current ROCE for Scicom (MSC) Berhad compares to its prior returns on capital, but there's only so much you can tell from the past. If you're interested, you can view the analysts predictions in our free analyst report for Scicom (MSC) Berhad .
How Are Returns Trending?
Scicom (MSC) Berhad deserves to be commended in regards to it's returns. The company has employed 39% more capital in the last five years, and the returns on that capital have remained stable at 27%. With returns that high, it's great that the business can continually reinvest its money at such appealing rates of return. If these trends can continue, it wouldn't surprise us if the company became a multi-bagger.
The Bottom Line On Scicom (MSC) Berhad's ROCE
In summary, we're delighted to see that Scicom (MSC) Berhad has been compounding returns by reinvesting at consistently high rates of return, as these are common traits of a multi-bagger. And given the stock has only risen 36% over the last five years, we'd suspect the market is beginning to recognize these trends. That's why it could be worth your time looking into this stock further to discover if it has more traits of a multi-bagger.
One more thing, we've spotted 2 warning signs facing Scicom (MSC) Berhad that you might find interesting.
Scicom (MSC) Berhad is not the only stock earning high returns. If you'd like to see more, check out our free list of companies earning high returns on equity with solid fundamentals.
Have feedback on this article? Concerned about the content? Get in touch with us directly. Alternatively, email editorial-team (at) simplywallst.com.
This article by Simply Wall St is general in nature. We provide commentary based on historical data and analyst forecasts only using an unbiased methodology and our articles are not intended to be financial advice. It does not constitute a recommendation to buy or sell any stock, and does not take account of your objectives, or your financial situation. We aim to bring you long-term focused analysis driven by fundamental data. Note that our analysis may not factor in the latest price-sensitive company announcements or qualitative material. Simply Wall St has no position in any stocks mentioned.
Have feedback on this article? Concerned about the content? Get in touch with us directly. Alternatively, email editorial-team@simplywallst.com
