
 Yahoo Finance
 The Returns At Open Text (NASDAQ:OTEX) Aren't Growing
Did you know there are some financial metrics that can provide clues of a potential multi-bagger? Ideally, a business will show two trends; firstly a growing return on capital employed (ROCE) and secondly, an increasing amount of capital employed. Basically this means that a company has profitable initiatives that it can continue to reinvest in, which is a trait of a compounding machine. However, after investigating Open Text (NASDAQ:OTEX), we don't think it's current trends fit the mold of a multi-bagger.
What Is Return On Capital Employed (ROCE)?
For those who don't know, ROCE is a measure of a company's yearly pre-tax profit (its return), relative to the capital employed in the business. Analysts use this formula to calculate it for Open Text:
Return on Capital Employed = Earnings Before Interest and Tax (EBIT) ÷ (Total Assets - Current Liabilities)
0.072 = US$966m ÷ (US$16b - US$3.0b) (Based on the trailing twelve months to March 2024).
So, Open Text has an ROCE of 7.2%. On its own that's a low return on capital but it's in line with the industry's average returns of 7.1%.
See our latest analysis for Open Text
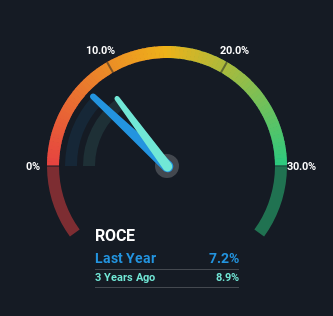
Above you can see how the current ROCE for Open Text compares to its prior returns on capital, but there's only so much you can tell from the past. If you'd like, you can check out the forecasts from the analysts covering Open Text for free.
What Does the ROCE Trend For Open Text Tell Us?
In terms of Open Text's historical ROCE trend, it doesn't exactly demand attention. Over the past five years, ROCE has remained relatively flat at around 7.2% and the business has deployed 96% more capital into its operations. Given the company has increased the amount of capital employed, it appears the investments that have been made simply don't provide a high return on capital.
The Key Takeaway
In summary, Open Text has simply been reinvesting capital and generating the same low rate of return as before. And in the last five years, the stock has given away 14% so the market doesn't look too hopeful on these trends strengthening any time soon. Therefore based on the analysis done in this article, we don't think Open Text has the makings of a multi-bagger.
One final note, you should learn about the 4 warning signs we've spotted with Open Text (including 1 which can't be ignored) .
While Open Text may not currently earn the highest returns, we've compiled a list of companies that currently earn more than 25% return on equity. Check out this free list here.
Have feedback on this article? Concerned about the content? Get in touch with us directly. Alternatively, email editorial-team (at) simplywallst.com.
This article by Simply Wall St is general in nature. We provide commentary based on historical data and analyst forecasts only using an unbiased methodology and our articles are not intended to be financial advice. It does not constitute a recommendation to buy or sell any stock, and does not take account of your objectives, or your financial situation. We aim to bring you long-term focused analysis driven by fundamental data. Note that our analysis may not factor in the latest price-sensitive company announcements or qualitative material. Simply Wall St has no position in any stocks mentioned.
