
 Yahoo Finance
 Returns At Mondelez International (NASDAQ:MDLZ) Are On The Way Up
If you're not sure where to start when looking for the next multi-bagger, there are a few key trends you should keep an eye out for. Ideally, a business will show two trends; firstly a growing return on capital employed (ROCE) and secondly, an increasing amount of capital employed. If you see this, it typically means it's a company with a great business model and plenty of profitable reinvestment opportunities. With that in mind, we've noticed some promising trends at Mondelez International (NASDAQ:MDLZ) so let's look a bit deeper.
Return On Capital Employed (ROCE): What Is It?
For those who don't know, ROCE is a measure of a company's yearly pre-tax profit (its return), relative to the capital employed in the business. To calculate this metric for Mondelez International, this is the formula:
Return on Capital Employed = Earnings Before Interest and Tax (EBIT) ÷ (Total Assets - Current Liabilities)
0.14 = US$7.2b ÷ (US$78b - US$25b) (Based on the trailing twelve months to March 2024).
Thus, Mondelez International has an ROCE of 14%. In absolute terms, that's a satisfactory return, but compared to the Food industry average of 11% it's much better.
View our latest analysis for Mondelez International
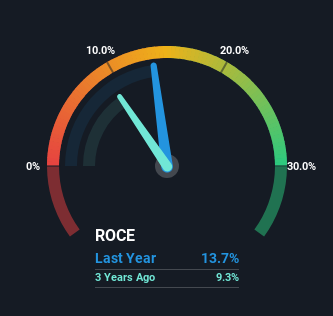
Above you can see how the current ROCE for Mondelez International compares to its prior returns on capital, but there's only so much you can tell from the past. If you'd like to see what analysts are forecasting going forward, you should check out our free analyst report for Mondelez International .
So How Is Mondelez International's ROCE Trending?
Mondelez International has not disappointed with their ROCE growth. The figures show that over the last five years, ROCE has grown 79% whilst employing roughly the same amount of capital. Basically the business is generating higher returns from the same amount of capital and that is proof that there are improvements in the company's efficiencies. On that front, things are looking good so it's worth exploring what management has said about growth plans going forward.
The Bottom Line
In summary, we're delighted to see that Mondelez International has been able to increase efficiencies and earn higher rates of return on the same amount of capital. Since the stock has only returned 36% to shareholders over the last five years, the promising fundamentals may not be recognized yet by investors. So with that in mind, we think the stock deserves further research.
On a final note, we've found 1 warning sign for Mondelez International that we think you should be aware of.
For those who like to invest in solid companies, check out this free list of companies with solid balance sheets and high returns on equity.
Have feedback on this article? Concerned about the content? Get in touch with us directly. Alternatively, email editorial-team (at) simplywallst.com.
This article by Simply Wall St is general in nature. We provide commentary based on historical data and analyst forecasts only using an unbiased methodology and our articles are not intended to be financial advice. It does not constitute a recommendation to buy or sell any stock, and does not take account of your objectives, or your financial situation. We aim to bring you long-term focused analysis driven by fundamental data. Note that our analysis may not factor in the latest price-sensitive company announcements or qualitative material. Simply Wall St has no position in any stocks mentioned.
Have feedback on this article? Concerned about the content? Get in touch with us directly. Alternatively, email editorial-team@simplywallst.com
