
 Yahoo Finance
 Returns At DRB-HICOM Berhad (KLSE:DRBHCOM) Are On The Way Up
If we want to find a potential multi-bagger, often there are underlying trends that can provide clues. Typically, we'll want to notice a trend of growing return on capital employed (ROCE) and alongside that, an expanding base of capital employed. This shows us that it's a compounding machine, able to continually reinvest its earnings back into the business and generate higher returns. So when we looked at DRB-HICOM Berhad (KLSE:DRBHCOM) and its trend of ROCE, we really liked what we saw.
What Is Return On Capital Employed (ROCE)?
Just to clarify if you're unsure, ROCE is a metric for evaluating how much pre-tax income (in percentage terms) a company earns on the capital invested in its business. Analysts use this formula to calculate it for DRB-HICOM Berhad:
Return on Capital Employed = Earnings Before Interest and Tax (EBIT) ÷ (Total Assets - Current Liabilities)
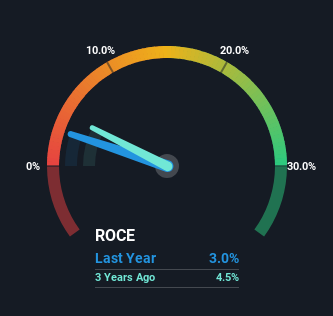
0.03 = RM625m ÷ (RM56b - RM35b) (Based on the trailing twelve months to September 2023).
Thus, DRB-HICOM Berhad has an ROCE of 3.0%. In absolute terms, that's a low return and it also under-performs the Auto industry average of 8.3%.
Check out our latest analysis for DRB-HICOM Berhad
Above you can see how the current ROCE for DRB-HICOM Berhad compares to its prior returns on capital, but there's only so much you can tell from the past. If you'd like, you can check out the forecasts from the analysts covering DRB-HICOM Berhad for free.
What Can We Tell From DRB-HICOM Berhad's ROCE Trend?
We're delighted to see that DRB-HICOM Berhad is reaping rewards from its investments and is now generating some pre-tax profits. Shareholders would no doubt be pleased with this because the business was loss-making five years ago but is is now generating 3.0% on its capital. And unsurprisingly, like most companies trying to break into the black, DRB-HICOM Berhad is utilizing 33% more capital than it was five years ago. This can tell us that the company has plenty of reinvestment opportunities that are able to generate higher returns.
On a side note, DRB-HICOM Berhad's current liabilities are still rather high at 63% of total assets. This can bring about some risks because the company is basically operating with a rather large reliance on its suppliers or other sorts of short-term creditors. While it's not necessarily a bad thing, it can be beneficial if this ratio is lower.
What We Can Learn From DRB-HICOM Berhad's ROCE
Overall, DRB-HICOM Berhad gets a big tick from us thanks in most part to the fact that it is now profitable and is reinvesting in its business. Astute investors may have an opportunity here because the stock has declined 16% in the last five years. With that in mind, we believe the promising trends warrant this stock for further investigation.
On a separate note, we've found 2 warning signs for DRB-HICOM Berhad you'll probably want to know about.
If you want to search for solid companies with great earnings, check out this free list of companies with good balance sheets and impressive returns on equity.
Have feedback on this article? Concerned about the content? Get in touch with us directly. Alternatively, email editorial-team (at) simplywallst.com.
This article by Simply Wall St is general in nature. We provide commentary based on historical data and analyst forecasts only using an unbiased methodology and our articles are not intended to be financial advice. It does not constitute a recommendation to buy or sell any stock, and does not take account of your objectives, or your financial situation. We aim to bring you long-term focused analysis driven by fundamental data. Note that our analysis may not factor in the latest price-sensitive company announcements or qualitative material. Simply Wall St has no position in any stocks mentioned.
