
 Yahoo Finance
 Returns On Capital At Union Pacific (NYSE:UNP) Have Hit The Brakes
If you're not sure where to start when looking for the next multi-bagger, there are a few key trends you should keep an eye out for. Typically, we'll want to notice a trend of growing return on capital employed (ROCE) and alongside that, an expanding base of capital employed. If you see this, it typically means it's a company with a great business model and plenty of profitable reinvestment opportunities. However, after investigating Union Pacific (NYSE:UNP), we don't think it's current trends fit the mold of a multi-bagger.
Understanding Return On Capital Employed (ROCE)
If you haven't worked with ROCE before, it measures the 'return' (pre-tax profit) a company generates from capital employed in its business. To calculate this metric for Union Pacific, this is the formula:
Return on Capital Employed = Earnings Before Interest and Tax (EBIT) ÷ (Total Assets - Current Liabilities)
0.15 = US$9.2b ÷ (US$67b - US$4.5b) (Based on the trailing twelve months to March 2024).
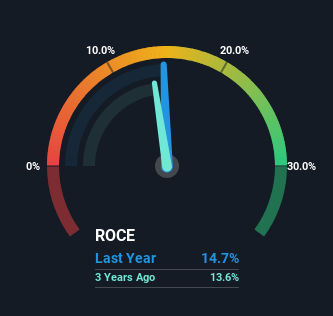
Therefore, Union Pacific has an ROCE of 15%. On its own, that's a standard return, however it's much better than the 7.1% generated by the Transportation industry.
View our latest analysis for Union Pacific
Above you can see how the current ROCE for Union Pacific compares to its prior returns on capital, but there's only so much you can tell from the past. If you're interested, you can view the analysts predictions in our free analyst report for Union Pacific .
What Can We Tell From Union Pacific's ROCE Trend?
Things have been pretty stable at Union Pacific, with its capital employed and returns on that capital staying somewhat the same for the last five years. Businesses with these traits tend to be mature and steady operations because they're past the growth phase. So don't be surprised if Union Pacific doesn't end up being a multi-bagger in a few years time. This probably explains why Union Pacific is paying out 41% of its income to shareholders in the form of dividends. Unless businesses have highly compelling growth opportunities, they'll typically return some money to shareholders.
The Key Takeaway
In summary, Union Pacific isn't compounding its earnings but is generating stable returns on the same amount of capital employed. Since the stock has gained an impressive 45% over the last five years, investors must think there's better things to come. However, unless these underlying trends turn more positive, we wouldn't get our hopes up too high.
One more thing to note, we've identified 1 warning sign with Union Pacific and understanding this should be part of your investment process.
For those who like to invest in solid companies, check out this free list of companies with solid balance sheets and high returns on equity.
Have feedback on this article? Concerned about the content? Get in touch with us directly. Alternatively, email editorial-team (at) simplywallst.com.
This article by Simply Wall St is general in nature. We provide commentary based on historical data and analyst forecasts only using an unbiased methodology and our articles are not intended to be financial advice. It does not constitute a recommendation to buy or sell any stock, and does not take account of your objectives, or your financial situation. We aim to bring you long-term focused analysis driven by fundamental data. Note that our analysis may not factor in the latest price-sensitive company announcements or qualitative material. Simply Wall St has no position in any stocks mentioned.
Have feedback on this article? Concerned about the content? Get in touch with us directly. Alternatively, email editorial-team@simplywallst.com
