
 Yahoo Finance
 Returns On Capital Are Showing Encouraging Signs At EnGro (SGX:S44)
To find a multi-bagger stock, what are the underlying trends we should look for in a business? Ideally, a business will show two trends; firstly a growing return on capital employed (ROCE) and secondly, an increasing amount of capital employed. If you see this, it typically means it's a company with a great business model and plenty of profitable reinvestment opportunities. So on that note, EnGro (SGX:S44) looks quite promising in regards to its trends of return on capital.
What Is Return On Capital Employed (ROCE)?
Just to clarify if you're unsure, ROCE is a metric for evaluating how much pre-tax income (in percentage terms) a company earns on the capital invested in its business. Analysts use this formula to calculate it for EnGro:
Return on Capital Employed = Earnings Before Interest and Tax (EBIT) ÷ (Total Assets - Current Liabilities)
0.009 = S$2.6m ÷ (S$317m - S$28m) (Based on the trailing twelve months to December 2023).
So, EnGro has an ROCE of 0.9%. In absolute terms, that's a low return and it also under-performs the Basic Materials industry average of 8.1%.
Check out our latest analysis for EnGro
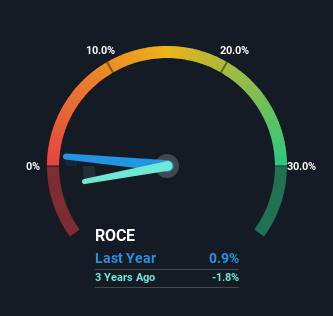
Historical performance is a great place to start when researching a stock so above you can see the gauge for EnGro's ROCE against it's prior returns. If you're interested in investigating EnGro's past further, check out this free graph covering EnGro's past earnings, revenue and cash flow.
The Trend Of ROCE
We're delighted to see that EnGro is reaping rewards from its investments and is now generating some pre-tax profits. Shareholders would no doubt be pleased with this because the business was loss-making five years ago but is is now generating 0.9% on its capital. Not only that, but the company is utilizing 23% more capital than before, but that's to be expected from a company trying to break into profitability. This can indicate that there's plenty of opportunities to invest capital internally and at ever higher rates, both common traits of a multi-bagger.
In Conclusion...
To the delight of most shareholders, EnGro has now broken into profitability. And given the stock has remained rather flat over the last five years, there might be an opportunity here if other metrics are strong. With that in mind, we believe the promising trends warrant this stock for further investigation.
Since virtually every company faces some risks, it's worth knowing what they are, and we've spotted 3 warning signs for EnGro (of which 1 doesn't sit too well with us!) that you should know about.
If you want to search for solid companies with great earnings, check out this free list of companies with good balance sheets and impressive returns on equity.
Have feedback on this article? Concerned about the content? Get in touch with us directly. Alternatively, email editorial-team (at) simplywallst.com.
This article by Simply Wall St is general in nature. We provide commentary based on historical data and analyst forecasts only using an unbiased methodology and our articles are not intended to be financial advice. It does not constitute a recommendation to buy or sell any stock, and does not take account of your objectives, or your financial situation. We aim to bring you long-term focused analysis driven by fundamental data. Note that our analysis may not factor in the latest price-sensitive company announcements or qualitative material. Simply Wall St has no position in any stocks mentioned.
