
 Yahoo Finance
 Returns On Capital At Pennant Group (NASDAQ:PNTG) Paint A Concerning Picture
If you're looking for a multi-bagger, there's a few things to keep an eye out for. One common approach is to try and find a company with returns on capital employed (ROCE) that are increasing, in conjunction with a growing amount of capital employed. This shows us that it's a compounding machine, able to continually reinvest its earnings back into the business and generate higher returns. However, after briefly looking over the numbers, we don't think Pennant Group (NASDAQ:PNTG) has the makings of a multi-bagger going forward, but let's have a look at why that may be.
Understanding Return On Capital Employed (ROCE)
For those that aren't sure what ROCE is, it measures the amount of pre-tax profits a company can generate from the capital employed in its business. Analysts use this formula to calculate it for Pennant Group:
Return on Capital Employed = Earnings Before Interest and Tax (EBIT) ÷ (Total Assets - Current Liabilities)
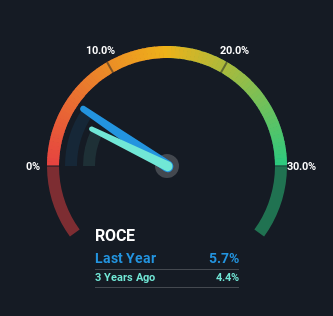
0.057 = US$29m ÷ (US$578m - US$75m) (Based on the trailing twelve months to March 2024).
Thus, Pennant Group has an ROCE of 5.7%. In absolute terms, that's a low return and it also under-performs the Healthcare industry average of 11%.
See our latest analysis for Pennant Group
In the above chart we have measured Pennant Group's prior ROCE against its prior performance, but the future is arguably more important. If you're interested, you can view the analysts predictions in our free analyst report for Pennant Group .
How Are Returns Trending?
On the surface, the trend of ROCE at Pennant Group doesn't inspire confidence. Around five years ago the returns on capital were 7.3%, but since then they've fallen to 5.7%. However, given capital employed and revenue have both increased it appears that the business is currently pursuing growth, at the consequence of short term returns. If these investments prove successful, this can bode very well for long term stock performance.
What We Can Learn From Pennant Group's ROCE
While returns have fallen for Pennant Group in recent times, we're encouraged to see that sales are growing and that the business is reinvesting in its operations. And there could be an opportunity here if other metrics look good too, because the stock has declined 42% in the last three years. As a result, we'd recommend researching this stock further to uncover what other fundamentals of the business can show us.
Like most companies, Pennant Group does come with some risks, and we've found 1 warning sign that you should be aware of.
If you want to search for solid companies with great earnings, check out this free list of companies with good balance sheets and impressive returns on equity.
Have feedback on this article? Concerned about the content? Get in touch with us directly. Alternatively, email editorial-team (at) simplywallst.com.
This article by Simply Wall St is general in nature. We provide commentary based on historical data and analyst forecasts only using an unbiased methodology and our articles are not intended to be financial advice. It does not constitute a recommendation to buy or sell any stock, and does not take account of your objectives, or your financial situation. We aim to bring you long-term focused analysis driven by fundamental data. Note that our analysis may not factor in the latest price-sensitive company announcements or qualitative material. Simply Wall St has no position in any stocks mentioned.
Have feedback on this article? Concerned about the content? Get in touch with us directly. Alternatively, email editorial-team@simplywallst.com
