
 Yahoo Finance
 Returns on Capital Paint A Bright Future For Coca-Cola Consolidated (NASDAQ:COKE)
If we want to find a potential multi-bagger, often there are underlying trends that can provide clues. Firstly, we'd want to identify a growing return on capital employed (ROCE) and then alongside that, an ever-increasing base of capital employed. Ultimately, this demonstrates that it's a business that is reinvesting profits at increasing rates of return. Speaking of which, we noticed some great changes in Coca-Cola Consolidated's (NASDAQ:COKE) returns on capital, so let's have a look.
Return On Capital Employed (ROCE): What Is It?
For those who don't know, ROCE is a measure of a company's yearly pre-tax profit (its return), relative to the capital employed in the business. To calculate this metric for Coca-Cola Consolidated, this is the formula:
Return on Capital Employed = Earnings Before Interest and Tax (EBIT) ÷ (Total Assets - Current Liabilities)
0.25 = US$839m ÷ (US$4.3b - US$918m) (Based on the trailing twelve months to March 2024).
Thus, Coca-Cola Consolidated has an ROCE of 25%. In absolute terms that's a great return and it's even better than the Beverage industry average of 17%.
Check out our latest analysis for Coca-Cola Consolidated
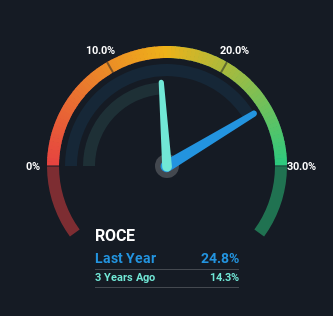
Historical performance is a great place to start when researching a stock so above you can see the gauge for Coca-Cola Consolidated's ROCE against it's prior returns. If you'd like to look at how Coca-Cola Consolidated has performed in the past in other metrics, you can view this free graph of Coca-Cola Consolidated's past earnings, revenue and cash flow.
The Trend Of ROCE
The trends we've noticed at Coca-Cola Consolidated are quite reassuring. Over the last five years, returns on capital employed have risen substantially to 25%. Basically the business is earning more per dollar of capital invested and in addition to that, 34% more capital is being employed now too. So we're very much inspired by what we're seeing at Coca-Cola Consolidated thanks to its ability to profitably reinvest capital.
The Bottom Line
To sum it up, Coca-Cola Consolidated has proven it can reinvest in the business and generate higher returns on that capital employed, which is terrific. And a remarkable 265% total return over the last five years tells us that investors are expecting more good things to come in the future. So given the stock has proven it has promising trends, it's worth researching the company further to see if these trends are likely to persist.
Like most companies, Coca-Cola Consolidated does come with some risks, and we've found 1 warning sign that you should be aware of.
Coca-Cola Consolidated is not the only stock earning high returns. If you'd like to see more, check out our free list of companies earning high returns on equity with solid fundamentals.
Have feedback on this article? Concerned about the content? Get in touch with us directly. Alternatively, email editorial-team (at) simplywallst.com.
This article by Simply Wall St is general in nature. We provide commentary based on historical data and analyst forecasts only using an unbiased methodology and our articles are not intended to be financial advice. It does not constitute a recommendation to buy or sell any stock, and does not take account of your objectives, or your financial situation. We aim to bring you long-term focused analysis driven by fundamental data. Note that our analysis may not factor in the latest price-sensitive company announcements or qualitative material. Simply Wall St has no position in any stocks mentioned.
Have feedback on this article? Concerned about the content? Get in touch with us directly. Alternatively, email editorial-team@simplywallst.com
