
 Yahoo Finance
 Returns on Capital Paint A Bright Future For Finning International (TSE:FTT)
If you're looking for a multi-bagger, there's a few things to keep an eye out for. One common approach is to try and find a company with returns on capital employed (ROCE) that are increasing, in conjunction with a growing amount of capital employed. This shows us that it's a compounding machine, able to continually reinvest its earnings back into the business and generate higher returns. Speaking of which, we noticed some great changes in Finning International's (TSE:FTT) returns on capital, so let's have a look.
What Is Return On Capital Employed (ROCE)?
Just to clarify if you're unsure, ROCE is a metric for evaluating how much pre-tax income (in percentage terms) a company earns on the capital invested in its business. The formula for this calculation on Finning International is:
Return on Capital Employed = Earnings Before Interest and Tax (EBIT) ÷ (Total Assets - Current Liabilities)
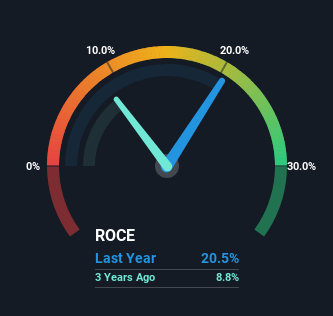
0.20 = CA$921m ÷ (CA$8.1b - CA$3.6b) (Based on the trailing twelve months to March 2024).
So, Finning International has an ROCE of 20%. That's a fantastic return and not only that, it outpaces the average of 14% earned by companies in a similar industry.
Check out our latest analysis for Finning International
In the above chart we have measured Finning International's prior ROCE against its prior performance, but the future is arguably more important. If you'd like, you can check out the forecasts from the analysts covering Finning International for free.
What Can We Tell From Finning International's ROCE Trend?
Finning International's ROCE growth is quite impressive. The figures show that over the last five years, ROCE has grown 90% whilst employing roughly the same amount of capital. Basically the business is generating higher returns from the same amount of capital and that is proof that there are improvements in the company's efficiencies. The company is doing well in that sense, and it's worth investigating what the management team has planned for long term growth prospects.
On a separate but related note, it's important to know that Finning International has a current liabilities to total assets ratio of 44%, which we'd consider pretty high. This effectively means that suppliers (or short-term creditors) are funding a large portion of the business, so just be aware that this can introduce some elements of risk. While it's not necessarily a bad thing, it can be beneficial if this ratio is lower.
In Conclusion...
To sum it up, Finning International is collecting higher returns from the same amount of capital, and that's impressive. And with the stock having performed exceptionally well over the last five years, these patterns are being accounted for by investors. With that being said, we still think the promising fundamentals mean the company deserves some further due diligence.
If you'd like to know more about Finning International, we've spotted 2 warning signs, and 1 of them is potentially serious.
If you want to search for more stocks that have been earning high returns, check out this free list of stocks with solid balance sheets that are also earning high returns on equity.
Have feedback on this article? Concerned about the content? Get in touch with us directly. Alternatively, email editorial-team (at) simplywallst.com.
This article by Simply Wall St is general in nature. We provide commentary based on historical data and analyst forecasts only using an unbiased methodology and our articles are not intended to be financial advice. It does not constitute a recommendation to buy or sell any stock, and does not take account of your objectives, or your financial situation. We aim to bring you long-term focused analysis driven by fundamental data. Note that our analysis may not factor in the latest price-sensitive company announcements or qualitative material. Simply Wall St has no position in any stocks mentioned.
