
 Yahoo Finance
 Returns On Capital At Landis+Gyr Group (VTX:LAND) Have Hit The Brakes
If we want to find a stock that could multiply over the long term, what are the underlying trends we should look for? Amongst other things, we'll want to see two things; firstly, a growing return on capital employed (ROCE) and secondly, an expansion in the company's amount of capital employed. Basically this means that a company has profitable initiatives that it can continue to reinvest in, which is a trait of a compounding machine. Having said that, from a first glance at Landis+Gyr Group (VTX:LAND) we aren't jumping out of our chairs at how returns are trending, but let's have a deeper look.
What Is Return On Capital Employed (ROCE)?
Just to clarify if you're unsure, ROCE is a metric for evaluating how much pre-tax income (in percentage terms) a company earns on the capital invested in its business. Analysts use this formula to calculate it for Landis+Gyr Group:
Return on Capital Employed = Earnings Before Interest and Tax (EBIT) ÷ (Total Assets - Current Liabilities)
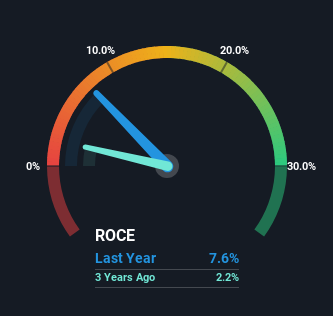
0.076 = US$154m ÷ (US$2.4b - US$424m) (Based on the trailing twelve months to March 2024).
So, Landis+Gyr Group has an ROCE of 7.6%. In absolute terms, that's a low return and it also under-performs the Electronic industry average of 10%.
Check out our latest analysis for Landis+Gyr Group
In the above chart we have measured Landis+Gyr Group's prior ROCE against its prior performance, but the future is arguably more important. If you'd like to see what analysts are forecasting going forward, you should check out our free analyst report for Landis+Gyr Group .
What Does the ROCE Trend For Landis+Gyr Group Tell Us?
There hasn't been much to report for Landis+Gyr Group's returns and its level of capital employed because both metrics have been steady for the past five years. This tells us the company isn't reinvesting in itself, so it's plausible that it's past the growth phase. With that in mind, unless investment picks up again in the future, we wouldn't expect Landis+Gyr Group to be a multi-bagger going forward. This probably explains why Landis+Gyr Group is paying out 43% of its income to shareholders in the form of dividends. Given the business isn't reinvesting in itself, it makes sense to distribute a portion of earnings among shareholders.
In Conclusion...
In summary, Landis+Gyr Group isn't compounding its earnings but is generating stable returns on the same amount of capital employed. And investors may be recognizing these trends since the stock has only returned a total of 3.9% to shareholders over the last five years. So if you're looking for a multi-bagger, the underlying trends indicate you may have better chances elsewhere.
On a final note, we've found 2 warning signs for Landis+Gyr Group that we think you should be aware of.
While Landis+Gyr Group may not currently earn the highest returns, we've compiled a list of companies that currently earn more than 25% return on equity. Check out this free list here.
Have feedback on this article? Concerned about the content? Get in touch with us directly. Alternatively, email editorial-team (at) simplywallst.com.
This article by Simply Wall St is general in nature. We provide commentary based on historical data and analyst forecasts only using an unbiased methodology and our articles are not intended to be financial advice. It does not constitute a recommendation to buy or sell any stock, and does not take account of your objectives, or your financial situation. We aim to bring you long-term focused analysis driven by fundamental data. Note that our analysis may not factor in the latest price-sensitive company announcements or qualitative material. Simply Wall St has no position in any stocks mentioned.
Have feedback on this article? Concerned about the content? Get in touch with us directly. Alternatively, email editorial-team@simplywallst.com
