
 Yahoo Finance
 The Returns On Capital At Lambo Group Berhad (KLSE:LAMBO) Don't Inspire Confidence
If you're looking for a multi-bagger, there's a few things to keep an eye out for. Firstly, we'll want to see a proven return on capital employed (ROCE) that is increasing, and secondly, an expanding base of capital employed. Basically this means that a company has profitable initiatives that it can continue to reinvest in, which is a trait of a compounding machine. In light of that, when we looked at Lambo Group Berhad (KLSE:LAMBO) and its ROCE trend, we weren't exactly thrilled.
What Is Return On Capital Employed (ROCE)?
Just to clarify if you're unsure, ROCE is a metric for evaluating how much pre-tax income (in percentage terms) a company earns on the capital invested in its business. The formula for this calculation on Lambo Group Berhad is:
Return on Capital Employed = Earnings Before Interest and Tax (EBIT) ÷ (Total Assets - Current Liabilities)
0.041 = RM7.0m ÷ (RM175m - RM4.7m) (Based on the trailing twelve months to December 2023).
So, Lambo Group Berhad has an ROCE of 4.1%. Ultimately, that's a low return and it under-performs the Software industry average of 11%.
View our latest analysis for Lambo Group Berhad
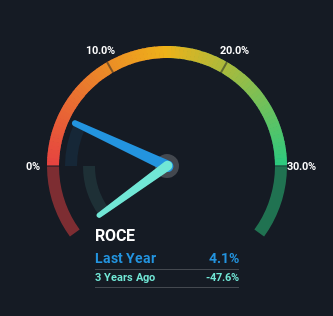
Historical performance is a great place to start when researching a stock so above you can see the gauge for Lambo Group Berhad's ROCE against it's prior returns. If you'd like to look at how Lambo Group Berhad has performed in the past in other metrics, you can view this free graph of Lambo Group Berhad's past earnings, revenue and cash flow.
What Does the ROCE Trend For Lambo Group Berhad Tell Us?
On the surface, the trend of ROCE at Lambo Group Berhad doesn't inspire confidence. Over the last five years, returns on capital have decreased to 4.1% from 20% five years ago. Although, given both revenue and the amount of assets employed in the business have increased, it could suggest the company is investing in growth, and the extra capital has led to a short-term reduction in ROCE. If these investments prove successful, this can bode very well for long term stock performance.
In Conclusion...
While returns have fallen for Lambo Group Berhad in recent times, we're encouraged to see that sales are growing and that the business is reinvesting in its operations. But since the stock has dived 96% in the last five years, there could be other drivers that are influencing the business' outlook. Regardless, reinvestment can pay off in the long run, so we think astute investors may want to look further into this stock.
If you'd like to know more about Lambo Group Berhad, we've spotted 5 warning signs, and 4 of them make us uncomfortable.
While Lambo Group Berhad may not currently earn the highest returns, we've compiled a list of companies that currently earn more than 25% return on equity. Check out this free list here.
Have feedback on this article? Concerned about the content? Get in touch with us directly. Alternatively, email editorial-team (at) simplywallst.com.
This article by Simply Wall St is general in nature. We provide commentary based on historical data and analyst forecasts only using an unbiased methodology and our articles are not intended to be financial advice. It does not constitute a recommendation to buy or sell any stock, and does not take account of your objectives, or your financial situation. We aim to bring you long-term focused analysis driven by fundamental data. Note that our analysis may not factor in the latest price-sensitive company announcements or qualitative material. Simply Wall St has no position in any stocks mentioned.
