
 Yahoo Finance
 The Returns On Capital At Kitwave Group (LON:KITW) Don't Inspire Confidence
Finding a business that has the potential to grow substantially is not easy, but it is possible if we look at a few key financial metrics. In a perfect world, we'd like to see a company investing more capital into its business and ideally the returns earned from that capital are also increasing. If you see this, it typically means it's a company with a great business model and plenty of profitable reinvestment opportunities. So when we looked at Kitwave Group (LON:KITW), they do have a high ROCE, but we weren't exactly elated from how returns are trending.
Understanding Return On Capital Employed (ROCE)
For those who don't know, ROCE is a measure of a company's yearly pre-tax profit (its return), relative to the capital employed in the business. The formula for this calculation on Kitwave Group is:
Return on Capital Employed = Earnings Before Interest and Tax (EBIT) ÷ (Total Assets - Current Liabilities)
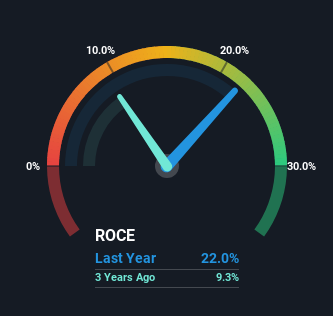
0.22 = UK£29m ÷ (UK£210m - UK£77m) (Based on the trailing twelve months to October 2023).
Therefore, Kitwave Group has an ROCE of 22%. In absolute terms that's a great return and it's even better than the Consumer Retailing industry average of 16%.
See our latest analysis for Kitwave Group
Above you can see how the current ROCE for Kitwave Group compares to its prior returns on capital, but there's only so much you can tell from the past. If you'd like to see what analysts are forecasting going forward, you should check out our free analyst report for Kitwave Group .
What The Trend Of ROCE Can Tell Us
On the surface, the trend of ROCE at Kitwave Group doesn't inspire confidence. To be more specific, while the ROCE is still high, it's fallen from 28% where it was five years ago. Although, given both revenue and the amount of assets employed in the business have increased, it could suggest the company is investing in growth, and the extra capital has led to a short-term reduction in ROCE. If these investments prove successful, this can bode very well for long term stock performance.
On a side note, Kitwave Group has done well to pay down its current liabilities to 37% of total assets. So we could link some of this to the decrease in ROCE. Effectively this means their suppliers or short-term creditors are funding less of the business, which reduces some elements of risk. Some would claim this reduces the business' efficiency at generating ROCE since it is now funding more of the operations with its own money.
What We Can Learn From Kitwave Group's ROCE
In summary, despite lower returns in the short term, we're encouraged to see that Kitwave Group is reinvesting for growth and has higher sales as a result. And long term investors must be optimistic going forward because the stock has returned a huge 161% to shareholders in the last three years. So while the underlying trends could already be accounted for by investors, we still think this stock is worth looking into further.
One more thing, we've spotted 2 warning signs facing Kitwave Group that you might find interesting.
High returns are a key ingredient to strong performance, so check out our free list ofstocks earning high returns on equity with solid balance sheets.
Have feedback on this article? Concerned about the content? Get in touch with us directly. Alternatively, email editorial-team (at) simplywallst.com.
This article by Simply Wall St is general in nature. We provide commentary based on historical data and analyst forecasts only using an unbiased methodology and our articles are not intended to be financial advice. It does not constitute a recommendation to buy or sell any stock, and does not take account of your objectives, or your financial situation. We aim to bring you long-term focused analysis driven by fundamental data. Note that our analysis may not factor in the latest price-sensitive company announcements or qualitative material. Simply Wall St has no position in any stocks mentioned.
