
 Yahoo Finance
 The Returns On Capital At Holley (NYSE:HLLY) Don't Inspire Confidence
If you're not sure where to start when looking for the next multi-bagger, there are a few key trends you should keep an eye out for. One common approach is to try and find a company with returns on capital employed (ROCE) that are increasing, in conjunction with a growing amount of capital employed. This shows us that it's a compounding machine, able to continually reinvest its earnings back into the business and generate higher returns. Having said that, from a first glance at Holley (NYSE:HLLY) we aren't jumping out of our chairs at how returns are trending, but let's have a deeper look.
What Is Return On Capital Employed (ROCE)?
If you haven't worked with ROCE before, it measures the 'return' (pre-tax profit) a company generates from capital employed in its business. To calculate this metric for Holley, this is the formula:
Return on Capital Employed = Earnings Before Interest and Tax (EBIT) ÷ (Total Assets - Current Liabilities)
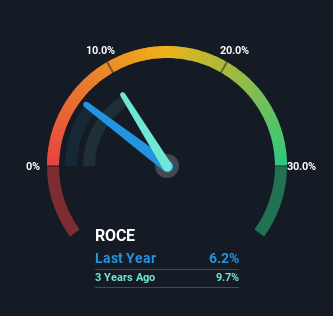
0.062 = US$70m ÷ (US$1.2b - US$89m) (Based on the trailing twelve months to October 2023).
Therefore, Holley has an ROCE of 6.2%. In absolute terms, that's a low return and it also under-performs the Auto Components industry average of 12%.
See our latest analysis for Holley
In the above chart we have measured Holley's prior ROCE against its prior performance, but the future is arguably more important. If you'd like, you can check out the forecasts from the analysts covering Holley here for free.
What Can We Tell From Holley's ROCE Trend?
On the surface, the trend of ROCE at Holley doesn't inspire confidence. To be more specific, ROCE has fallen from 9.7% over the last three years. On the other hand, the company has been employing more capital without a corresponding improvement in sales in the last year, which could suggest these investments are longer term plays. It's worth keeping an eye on the company's earnings from here on to see if these investments do end up contributing to the bottom line.
Our Take On Holley's ROCE
In summary, Holley is reinvesting funds back into the business for growth but unfortunately it looks like sales haven't increased much just yet. And investors appear hesitant that the trends will pick up because the stock has fallen 52% in the last three years. On the whole, we aren't too inspired by the underlying trends and we think there may be better chances of finding a multi-bagger elsewhere.
Since virtually every company faces some risks, it's worth knowing what they are, and we've spotted 3 warning signs for Holley (of which 1 is a bit unpleasant!) that you should know about.
For those who like to invest in solid companies, check out this free list of companies with solid balance sheets and high returns on equity.
Have feedback on this article? Concerned about the content? Get in touch with us directly. Alternatively, email editorial-team (at) simplywallst.com.
This article by Simply Wall St is general in nature. We provide commentary based on historical data and analyst forecasts only using an unbiased methodology and our articles are not intended to be financial advice. It does not constitute a recommendation to buy or sell any stock, and does not take account of your objectives, or your financial situation. We aim to bring you long-term focused analysis driven by fundamental data. Note that our analysis may not factor in the latest price-sensitive company announcements or qualitative material. Simply Wall St has no position in any stocks mentioned.
