
 Yahoo Finance
 Returns On Capital At BitFuFu (NASDAQ:FUFU) Paint A Concerning Picture
If you're looking for a multi-bagger, there's a few things to keep an eye out for. One common approach is to try and find a company with returns on capital employed (ROCE) that are increasing, in conjunction with a growing amount of capital employed. Put simply, these types of businesses are compounding machines, meaning they are continually reinvesting their earnings at ever-higher rates of return. However, after briefly looking over the numbers, we don't think BitFuFu (NASDAQ:FUFU) has the makings of a multi-bagger going forward, but let's have a look at why that may be.
What Is Return On Capital Employed (ROCE)?
If you haven't worked with ROCE before, it measures the 'return' (pre-tax profit) a company generates from capital employed in its business. The formula for this calculation on BitFuFu is:
Return on Capital Employed = Earnings Before Interest and Tax (EBIT) ÷ (Total Assets - Current Liabilities)
0.10 = US$24m ÷ (US$307m - US$76m) (Based on the trailing twelve months to March 2024).
Thus, BitFuFu has an ROCE of 10%. In absolute terms, that's a satisfactory return, but compared to the Software industry average of 7.4% it's much better.
See our latest analysis for BitFuFu
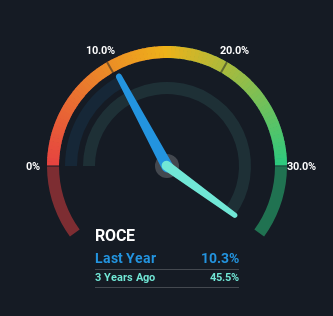
Historical performance is a great place to start when researching a stock so above you can see the gauge for BitFuFu's ROCE against it's prior returns. If you want to delve into the historical earnings , check out these free graphs detailing revenue and cash flow performance of BitFuFu.
The Trend Of ROCE
On the surface, the trend of ROCE at BitFuFu doesn't inspire confidence. Around three years ago the returns on capital were 46%, but since then they've fallen to 10%. Although, given both revenue and the amount of assets employed in the business have increased, it could suggest the company is investing in growth, and the extra capital has led to a short-term reduction in ROCE. If these investments prove successful, this can bode very well for long term stock performance.
On a related note, BitFuFu has decreased its current liabilities to 25% of total assets. Considering it used to be 96%, that's a huge drop in that ratio and it would explain the decline in ROCE. What's more, this can reduce some aspects of risk to the business because now the company's suppliers or short-term creditors are funding less of its operations. Some would claim this reduces the business' efficiency at generating ROCE since it is now funding more of the operations with its own money.
The Bottom Line On BitFuFu's ROCE
Even though returns on capital have fallen in the short term, we find it promising that revenue and capital employed have both increased for BitFuFu. However, despite the promising trends, the stock has fallen 63% over the last year, so there might be an opportunity here for astute investors. So we think it'd be worthwhile to look further into this stock given the trends look encouraging.
On a separate note, we've found 1 warning sign for BitFuFu you'll probably want to know about.
While BitFuFu may not currently earn the highest returns, we've compiled a list of companies that currently earn more than 25% return on equity. Check out this free list here.
Have feedback on this article? Concerned about the content? Get in touch with us directly. Alternatively, email editorial-team (at) simplywallst.com.
This article by Simply Wall St is general in nature. We provide commentary based on historical data and analyst forecasts only using an unbiased methodology and our articles are not intended to be financial advice. It does not constitute a recommendation to buy or sell any stock, and does not take account of your objectives, or your financial situation. We aim to bring you long-term focused analysis driven by fundamental data. Note that our analysis may not factor in the latest price-sensitive company announcements or qualitative material. Simply Wall St has no position in any stocks mentioned.
Have feedback on this article? Concerned about the content? Get in touch with us directly. Alternatively, email editorial-team@simplywallst.com
