
 Yahoo Finance
 Returns On Capital At African Media Entertainment (JSE:AME) Have Stalled
There are a few key trends to look for if we want to identify the next multi-bagger. Amongst other things, we'll want to see two things; firstly, a growing return on capital employed (ROCE) and secondly, an expansion in the company's amount of capital employed. Ultimately, this demonstrates that it's a business that is reinvesting profits at increasing rates of return. So while African Media Entertainment (JSE:AME) has a high ROCE right now, lets see what we can decipher from how returns are changing.
What Is Return On Capital Employed (ROCE)?
Just to clarify if you're unsure, ROCE is a metric for evaluating how much pre-tax income (in percentage terms) a company earns on the capital invested in its business. Analysts use this formula to calculate it for African Media Entertainment:
Return on Capital Employed = Earnings Before Interest and Tax (EBIT) ÷ (Total Assets - Current Liabilities)
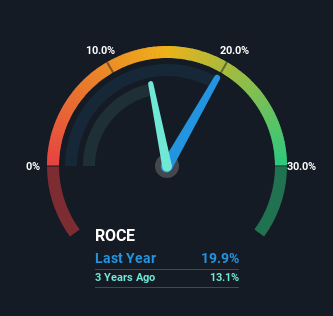
0.20 = R52m ÷ (R339m - R77m) (Based on the trailing twelve months to September 2023).
Therefore, African Media Entertainment has an ROCE of 20%. In absolute terms that's a great return and it's even better than the Media industry average of 11%.
View our latest analysis for African Media Entertainment
While the past is not representative of the future, it can be helpful to know how a company has performed historically, which is why we have this chart above. If you'd like to look at how African Media Entertainment has performed in the past in other metrics, you can view this free graph of African Media Entertainment's past earnings, revenue and cash flow.
What The Trend Of ROCE Can Tell Us
There hasn't been much to report for African Media Entertainment's returns and its level of capital employed because both metrics have been steady for the past five years. Businesses with these traits tend to be mature and steady operations because they're past the growth phase. So while the current operations are delivering respectable returns, unless capital employed increases we'd be hard-pressed to believe it's a multi-bagger going forward.
In Conclusion...
Although is allocating it's capital efficiently to generate impressive returns, it isn't compounding its base of capital, which is what we'd see from a multi-bagger. Unsurprisingly, the stock has only gained 21% over the last five years, which potentially indicates that investors are accounting for this going forward. Therefore, if you're looking for a multi-bagger, we'd propose looking at other options.
African Media Entertainment does have some risks, we noticed 4 warning signs (and 2 which are a bit unpleasant) we think you should know about.
If you'd like to see other companies earning high returns, check out our free list of companies earning high returns with solid balance sheets here.
Have feedback on this article? Concerned about the content? Get in touch with us directly. Alternatively, email editorial-team (at) simplywallst.com.
This article by Simply Wall St is general in nature. We provide commentary based on historical data and analyst forecasts only using an unbiased methodology and our articles are not intended to be financial advice. It does not constitute a recommendation to buy or sell any stock, and does not take account of your objectives, or your financial situation. We aim to bring you long-term focused analysis driven by fundamental data. Note that our analysis may not factor in the latest price-sensitive company announcements or qualitative material. Simply Wall St has no position in any stocks mentioned.
