
 Yahoo Finance
 The Returns At Avolta (VTX:AVOL) Aren't Growing
Finding a business that has the potential to grow substantially is not easy, but it is possible if we look at a few key financial metrics. Amongst other things, we'll want to see two things; firstly, a growing return on capital employed (ROCE) and secondly, an expansion in the company's amount of capital employed. This shows us that it's a compounding machine, able to continually reinvest its earnings back into the business and generate higher returns. Having said that, from a first glance at Avolta (VTX:AVOL) we aren't jumping out of our chairs at how returns are trending, but let's have a deeper look.
Return On Capital Employed (ROCE): What Is It?
For those that aren't sure what ROCE is, it measures the amount of pre-tax profits a company can generate from the capital employed in its business. The formula for this calculation on Avolta is:
Return on Capital Employed = Earnings Before Interest and Tax (EBIT) ÷ (Total Assets - Current Liabilities)
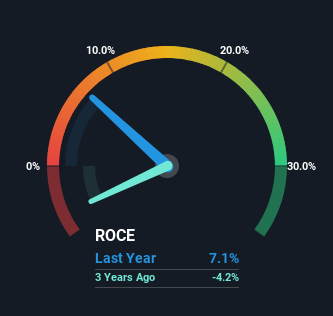
0.071 = CHF705m ÷ (CHF14b - CHF3.7b) (Based on the trailing twelve months to June 2023).
Thus, Avolta has an ROCE of 7.1%. Ultimately, that's a low return and it under-performs the Specialty Retail industry average of 11%.
View our latest analysis for Avolta
In the above chart we have measured Avolta's prior ROCE against its prior performance, but the future is arguably more important. If you'd like to see what analysts are forecasting going forward, you should check out our free analyst report for Avolta .
What Can We Tell From Avolta's ROCE Trend?
The returns on capital haven't changed much for Avolta in recent years. Over the past five years, ROCE has remained relatively flat at around 7.1% and the business has deployed 25% more capital into its operations. Given the company has increased the amount of capital employed, it appears the investments that have been made simply don't provide a high return on capital.
In Conclusion...
In summary, Avolta has simply been reinvesting capital and generating the same low rate of return as before. And investors appear hesitant that the trends will pick up because the stock has fallen 64% in the last five years. Therefore based on the analysis done in this article, we don't think Avolta has the makings of a multi-bagger.
Since virtually every company faces some risks, it's worth knowing what they are, and we've spotted 3 warning signs for Avolta (of which 1 shouldn't be ignored!) that you should know about.
If you want to search for solid companies with great earnings, check out this free list of companies with good balance sheets and impressive returns on equity.
Have feedback on this article? Concerned about the content? Get in touch with us directly. Alternatively, email editorial-team (at) simplywallst.com.
This article by Simply Wall St is general in nature. We provide commentary based on historical data and analyst forecasts only using an unbiased methodology and our articles are not intended to be financial advice. It does not constitute a recommendation to buy or sell any stock, and does not take account of your objectives, or your financial situation. We aim to bring you long-term focused analysis driven by fundamental data. Note that our analysis may not factor in the latest price-sensitive company announcements or qualitative material. Simply Wall St has no position in any stocks mentioned.
