
 Yahoo Finance
 Return Trends At Twin Disc (NASDAQ:TWIN) Aren't Appealing
Finding a business that has the potential to grow substantially is not easy, but it is possible if we look at a few key financial metrics. Ideally, a business will show two trends; firstly a growing return on capital employed (ROCE) and secondly, an increasing amount of capital employed. If you see this, it typically means it's a company with a great business model and plenty of profitable reinvestment opportunities. Although, when we looked at Twin Disc (NASDAQ:TWIN), it didn't seem to tick all of these boxes.
Understanding Return On Capital Employed (ROCE)
Just to clarify if you're unsure, ROCE is a metric for evaluating how much pre-tax income (in percentage terms) a company earns on the capital invested in its business. To calculate this metric for Twin Disc, this is the formula:
Return on Capital Employed = Earnings Before Interest and Tax (EBIT) ÷ (Total Assets - Current Liabilities)
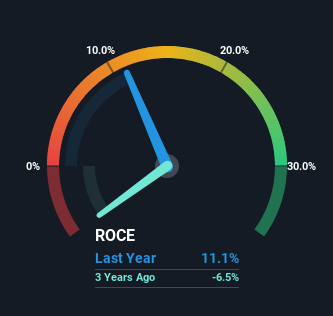
0.11 = US$21m ÷ (US$289m - US$99m) (Based on the trailing twelve months to March 2024).
Thus, Twin Disc has an ROCE of 11%. In absolute terms, that's a pretty normal return, and it's somewhat close to the Machinery industry average of 13%.
View our latest analysis for Twin Disc
While the past is not representative of the future, it can be helpful to know how a company has performed historically, which is why we have this chart above. If you're interested in investigating Twin Disc's past further, check out this free graph covering Twin Disc's past earnings, revenue and cash flow.
What Can We Tell From Twin Disc's ROCE Trend?
We're a bit concerned with the trends, because the business is applying 31% less capital than it was five years ago and returns on that capital have stayed flat. When a company effectively decreases its assets base, it's not usually a sign to be optimistic on that company. You could assume that if this continues, the business will be smaller in a few year time, so probably not a multi-bagger.
Another point to note, we noticed the company has increased current liabilities over the last five years. This is intriguing because if current liabilities hadn't increased to 34% of total assets, this reported ROCE would probably be less than11% because total capital employed would be higher.The 11% ROCE could be even lower if current liabilities weren't 34% of total assets, because the the formula would show a larger base of total capital employed. With that in mind, just be wary if this ratio increases in the future, because if it gets particularly high, this brings with it some new elements of risk.
In Conclusion...
It's a shame to see that Twin Disc is effectively shrinking in terms of its capital base. Additionally, the stock's total return to shareholders over the last five years has been flat, which isn't too surprising. Therefore based on the analysis done in this article, we don't think Twin Disc has the makings of a multi-bagger.
On a separate note, we've found 2 warning signs for Twin Disc you'll probably want to know about.
For those who like to invest in solid companies, check out this free list of companies with solid balance sheets and high returns on equity.
Have feedback on this article? Concerned about the content? Get in touch with us directly. Alternatively, email editorial-team (at) simplywallst.com.
This article by Simply Wall St is general in nature. We provide commentary based on historical data and analyst forecasts only using an unbiased methodology and our articles are not intended to be financial advice. It does not constitute a recommendation to buy or sell any stock, and does not take account of your objectives, or your financial situation. We aim to bring you long-term focused analysis driven by fundamental data. Note that our analysis may not factor in the latest price-sensitive company announcements or qualitative material. Simply Wall St has no position in any stocks mentioned.
