
 Yahoo Finance
 The Return Trends At Pan-United (SGX:P52) Look Promising
What trends should we look for it we want to identify stocks that can multiply in value over the long term? Firstly, we'd want to identify a growing return on capital employed (ROCE) and then alongside that, an ever-increasing base of capital employed. Basically this means that a company has profitable initiatives that it can continue to reinvest in, which is a trait of a compounding machine. So on that note, Pan-United (SGX:P52) looks quite promising in regards to its trends of return on capital.
Return On Capital Employed (ROCE): What Is It?
For those that aren't sure what ROCE is, it measures the amount of pre-tax profits a company can generate from the capital employed in its business. Analysts use this formula to calculate it for Pan-United:
Return on Capital Employed = Earnings Before Interest and Tax (EBIT) ÷ (Total Assets - Current Liabilities)
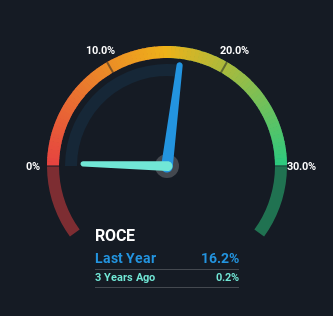
0.16 = S$47m ÷ (S$454m - S$166m) (Based on the trailing twelve months to December 2023).
So, Pan-United has an ROCE of 16%. In absolute terms, that's a satisfactory return, but compared to the Trade Distributors industry average of 7.5% it's much better.
View our latest analysis for Pan-United
In the above chart we have measured Pan-United's prior ROCE against its prior performance, but the future is arguably more important. If you're interested, you can view the analysts predictions in our free analyst report for Pan-United .
So How Is Pan-United's ROCE Trending?
Pan-United has not disappointed with their ROCE growth. The figures show that over the last five years, ROCE has grown 279% whilst employing roughly the same amount of capital. So our take on this is that the business has increased efficiencies to generate these higher returns, all the while not needing to make any additional investments. The company is doing well in that sense, and it's worth investigating what the management team has planned for long term growth prospects.
The Bottom Line On Pan-United's ROCE
To bring it all together, Pan-United has done well to increase the returns it's generating from its capital employed. Since the stock has returned a solid 95% to shareholders over the last five years, it's fair to say investors are beginning to recognize these changes. In light of that, we think it's worth looking further into this stock because if Pan-United can keep these trends up, it could have a bright future ahead.
If you'd like to know about the risks facing Pan-United, we've discovered 1 warning sign that you should be aware of.
For those who like to invest in solid companies, check out this free list of companies with solid balance sheets and high returns on equity.
Have feedback on this article? Concerned about the content? Get in touch with us directly. Alternatively, email editorial-team (at) simplywallst.com.
This article by Simply Wall St is general in nature. We provide commentary based on historical data and analyst forecasts only using an unbiased methodology and our articles are not intended to be financial advice. It does not constitute a recommendation to buy or sell any stock, and does not take account of your objectives, or your financial situation. We aim to bring you long-term focused analysis driven by fundamental data. Note that our analysis may not factor in the latest price-sensitive company announcements or qualitative material. Simply Wall St has no position in any stocks mentioned.
Have feedback on this article? Concerned about the content? Get in touch with us directly. Alternatively, email editorial-team@simplywallst.com
