
 Yahoo Finance
 Return Trends At Coca-Cola Europacific Partners (AMS:CCEP) Aren't Appealing
To find a multi-bagger stock, what are the underlying trends we should look for in a business? Amongst other things, we'll want to see two things; firstly, a growing return on capital employed (ROCE) and secondly, an expansion in the company's amount of capital employed. Put simply, these types of businesses are compounding machines, meaning they are continually reinvesting their earnings at ever-higher rates of return. So, when we ran our eye over Coca-Cola Europacific Partners' (AMS:CCEP) trend of ROCE, we liked what we saw.
Understanding Return On Capital Employed (ROCE)
For those who don't know, ROCE is a measure of a company's yearly pre-tax profit (its return), relative to the capital employed in the business. To calculate this metric for Coca-Cola Europacific Partners, this is the formula:
Return on Capital Employed = Earnings Before Interest and Tax (EBIT) ÷ (Total Assets - Current Liabilities)
0.11 = €2.4b ÷ (€29b - €7.3b) (Based on the trailing twelve months to December 2023).
Therefore, Coca-Cola Europacific Partners has an ROCE of 11%. That's a relatively normal return on capital, and it's around the 10% generated by the Beverage industry.
Check out our latest analysis for Coca-Cola Europacific Partners
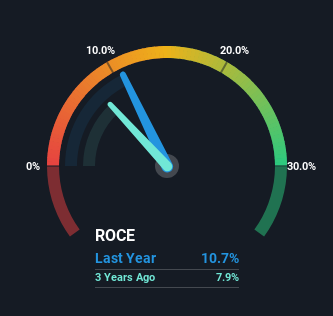
In the above chart we have measured Coca-Cola Europacific Partners' prior ROCE against its prior performance, but the future is arguably more important. If you'd like to see what analysts are forecasting going forward, you should check out our free analyst report for Coca-Cola Europacific Partners .
What The Trend Of ROCE Can Tell Us
While the current returns on capital are decent, they haven't changed much. Over the past five years, ROCE has remained relatively flat at around 11% and the business has deployed 52% more capital into its operations. Since 11% is a moderate ROCE though, it's good to see a business can continue to reinvest at these decent rates of return. Stable returns in this ballpark can be unexciting, but if they can be maintained over the long run, they often provide nice rewards to shareholders.
The Bottom Line
To sum it up, Coca-Cola Europacific Partners has simply been reinvesting capital steadily, at those decent rates of return. And since the stock has risen strongly over the last five years, it appears the market might expect this trend to continue. So even though the stock might be more "expensive" than it was before, we think the strong fundamentals warrant this stock for further research.
On a separate note, we've found 2 warning signs for Coca-Cola Europacific Partners you'll probably want to know about.
While Coca-Cola Europacific Partners may not currently earn the highest returns, we've compiled a list of companies that currently earn more than 25% return on equity. Check out this free list here.
Have feedback on this article? Concerned about the content? Get in touch with us directly. Alternatively, email editorial-team (at) simplywallst.com.
This article by Simply Wall St is general in nature. We provide commentary based on historical data and analyst forecasts only using an unbiased methodology and our articles are not intended to be financial advice. It does not constitute a recommendation to buy or sell any stock, and does not take account of your objectives, or your financial situation. We aim to bring you long-term focused analysis driven by fundamental data. Note that our analysis may not factor in the latest price-sensitive company announcements or qualitative material. Simply Wall St has no position in any stocks mentioned.
Have feedback on this article? Concerned about the content? Get in touch with us directly. Alternatively, email editorial-team@simplywallst.com
