
 Yahoo Finance
 Return Trends At Albany International (NYSE:AIN) Aren't Appealing
Did you know there are some financial metrics that can provide clues of a potential multi-bagger? Ideally, a business will show two trends; firstly a growing return on capital employed (ROCE) and secondly, an increasing amount of capital employed. Put simply, these types of businesses are compounding machines, meaning they are continually reinvesting their earnings at ever-higher rates of return. That's why when we briefly looked at Albany International's (NYSE:AIN) ROCE trend, we were pretty happy with what we saw.
Understanding Return On Capital Employed (ROCE)
For those that aren't sure what ROCE is, it measures the amount of pre-tax profits a company can generate from the capital employed in its business. The formula for this calculation on Albany International is:
Return on Capital Employed = Earnings Before Interest and Tax (EBIT) ÷ (Total Assets - Current Liabilities)
0.12 = US$183m ÷ (US$1.8b - US$212m) (Based on the trailing twelve months to March 2024).
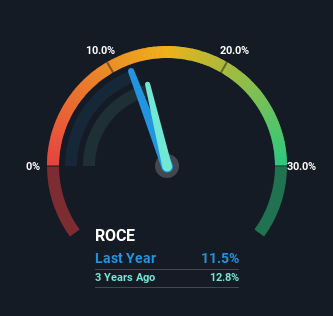
So, Albany International has an ROCE of 12%. In absolute terms, that's a pretty normal return, and it's somewhat close to the Machinery industry average of 13%.
See our latest analysis for Albany International
In the above chart we have measured Albany International's prior ROCE against its prior performance, but the future is arguably more important. If you'd like to see what analysts are forecasting going forward, you should check out our free analyst report for Albany International .
So How Is Albany International's ROCE Trending?
The trend of ROCE doesn't stand out much, but returns on a whole are decent. The company has employed 28% more capital in the last five years, and the returns on that capital have remained stable at 12%. Since 12% is a moderate ROCE though, it's good to see a business can continue to reinvest at these decent rates of return. Stable returns in this ballpark can be unexciting, but if they can be maintained over the long run, they often provide nice rewards to shareholders.
In Conclusion...
To sum it up, Albany International has simply been reinvesting capital steadily, at those decent rates of return. However, over the last five years, the stock has only delivered a 9.1% return to shareholders who held over that period. So because of the trends we're seeing, we'd recommend looking further into this stock to see if it has the makings of a multi-bagger.
While Albany International doesn't shine too bright in this respect, it's still worth seeing if the company is trading at attractive prices. You can find that out with our FREE intrinsic value estimation for AIN on our platform.
While Albany International may not currently earn the highest returns, we've compiled a list of companies that currently earn more than 25% return on equity. Check out this free list here.
Have feedback on this article? Concerned about the content? Get in touch with us directly. Alternatively, email editorial-team (at) simplywallst.com.
This article by Simply Wall St is general in nature. We provide commentary based on historical data and analyst forecasts only using an unbiased methodology and our articles are not intended to be financial advice. It does not constitute a recommendation to buy or sell any stock, and does not take account of your objectives, or your financial situation. We aim to bring you long-term focused analysis driven by fundamental data. Note that our analysis may not factor in the latest price-sensitive company announcements or qualitative material. Simply Wall St has no position in any stocks mentioned.
Have feedback on this article? Concerned about the content? Get in touch with us directly. Alternatively, email editorial-team@simplywallst.com
