
 Yahoo Finance
 These Return Metrics Don't Make Astro Malaysia Holdings Berhad (KLSE:ASTRO) Look Too Strong
If we're looking to avoid a business that is in decline, what are the trends that can warn us ahead of time? When we see a declining return on capital employed (ROCE) in conjunction with a declining base of capital employed, that's often how a mature business shows signs of aging. This indicates the company is producing less profit from its investments and its total assets are decreasing. And from a first read, things don't look too good at Astro Malaysia Holdings Berhad (KLSE:ASTRO), so let's see why.
Understanding Return On Capital Employed (ROCE)
If you haven't worked with ROCE before, it measures the 'return' (pre-tax profit) a company generates from capital employed in its business. The formula for this calculation on Astro Malaysia Holdings Berhad is:
Return on Capital Employed = Earnings Before Interest and Tax (EBIT) ÷ (Total Assets - Current Liabilities)
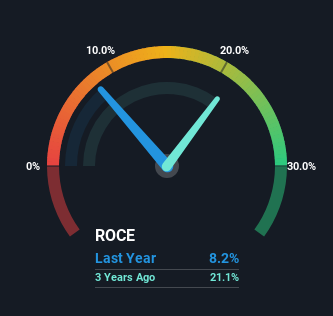
0.082 = RM361m ÷ (RM5.7b - RM1.3b) (Based on the trailing twelve months to January 2024).
Thus, Astro Malaysia Holdings Berhad has an ROCE of 8.2%. Even though it's in line with the industry average of 8.4%, it's still a low return by itself.
Check out our latest analysis for Astro Malaysia Holdings Berhad
Above you can see how the current ROCE for Astro Malaysia Holdings Berhad compares to its prior returns on capital, but there's only so much you can tell from the past. If you'd like, you can check out the forecasts from the analysts covering Astro Malaysia Holdings Berhad for free.
What Does the ROCE Trend For Astro Malaysia Holdings Berhad Tell Us?
We are a bit worried about the trend of returns on capital at Astro Malaysia Holdings Berhad. To be more specific, the ROCE was 22% five years ago, but since then it has dropped noticeably. On top of that, it's worth noting that the amount of capital employed within the business has remained relatively steady. Since returns are falling and the business has the same amount of assets employed, this can suggest it's a mature business that hasn't had much growth in the last five years. So because these trends aren't typically conducive to creating a multi-bagger, we wouldn't hold our breath on Astro Malaysia Holdings Berhad becoming one if things continue as they have.
What We Can Learn From Astro Malaysia Holdings Berhad's ROCE
In summary, it's unfortunate that Astro Malaysia Holdings Berhad is generating lower returns from the same amount of capital. This could explain why the stock has sunk a total of 73% in the last five years. Unless there is a shift to a more positive trajectory in these metrics, we would look elsewhere.
One final note, you should learn about the 2 warning signs we've spotted with Astro Malaysia Holdings Berhad (including 1 which is concerning) .
While Astro Malaysia Holdings Berhad isn't earning the highest return, check out this free list of companies that are earning high returns on equity with solid balance sheets.
Have feedback on this article? Concerned about the content? Get in touch with us directly. Alternatively, email editorial-team (at) simplywallst.com.
This article by Simply Wall St is general in nature. We provide commentary based on historical data and analyst forecasts only using an unbiased methodology and our articles are not intended to be financial advice. It does not constitute a recommendation to buy or sell any stock, and does not take account of your objectives, or your financial situation. We aim to bring you long-term focused analysis driven by fundamental data. Note that our analysis may not factor in the latest price-sensitive company announcements or qualitative material. Simply Wall St has no position in any stocks mentioned.
