
 Yahoo Finance
 Reject Shop (ASX:TRS) Will Be Hoping To Turn Its Returns On Capital Around
Did you know there are some financial metrics that can provide clues of a potential multi-bagger? In a perfect world, we'd like to see a company investing more capital into its business and ideally the returns earned from that capital are also increasing. Put simply, these types of businesses are compounding machines, meaning they are continually reinvesting their earnings at ever-higher rates of return. However, after investigating Reject Shop (ASX:TRS), we don't think it's current trends fit the mold of a multi-bagger.
What Is Return On Capital Employed (ROCE)?
For those that aren't sure what ROCE is, it measures the amount of pre-tax profits a company can generate from the capital employed in its business. To calculate this metric for Reject Shop, this is the formula:
Return on Capital Employed = Earnings Before Interest and Tax (EBIT) ÷ (Total Assets - Current Liabilities)
0.044 = AU$14m ÷ (AU$494m - AU$168m) (Based on the trailing twelve months to December 2023).
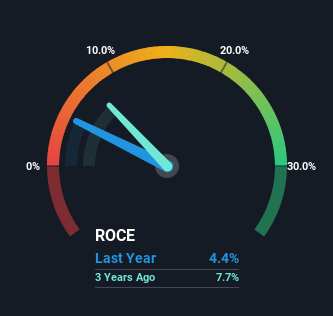
So, Reject Shop has an ROCE of 4.4%. In absolute terms, that's a low return and it also under-performs the Multiline Retail industry average of 9.6%.
See our latest analysis for Reject Shop
Above you can see how the current ROCE for Reject Shop compares to its prior returns on capital, but there's only so much you can tell from the past. If you'd like, you can check out the forecasts from the analysts covering Reject Shop for free.
So How Is Reject Shop's ROCE Trending?
In terms of Reject Shop's historical ROCE movements, the trend isn't fantastic. Around five years ago the returns on capital were 7.6%, but since then they've fallen to 4.4%. Meanwhile, the business is utilizing more capital but this hasn't moved the needle much in terms of sales in the past 12 months, so this could reflect longer term investments. It may take some time before the company starts to see any change in earnings from these investments.
The Bottom Line
To conclude, we've found that Reject Shop is reinvesting in the business, but returns have been falling. Since the stock has gained an impressive 73% over the last five years, investors must think there's better things to come. But if the trajectory of these underlying trends continue, we think the likelihood of it being a multi-bagger from here isn't high.
On a final note, we've found 3 warning signs for Reject Shop that we think you should be aware of.
While Reject Shop may not currently earn the highest returns, we've compiled a list of companies that currently earn more than 25% return on equity. Check out this free list here.
Have feedback on this article? Concerned about the content? Get in touch with us directly. Alternatively, email editorial-team (at) simplywallst.com.
This article by Simply Wall St is general in nature. We provide commentary based on historical data and analyst forecasts only using an unbiased methodology and our articles are not intended to be financial advice. It does not constitute a recommendation to buy or sell any stock, and does not take account of your objectives, or your financial situation. We aim to bring you long-term focused analysis driven by fundamental data. Note that our analysis may not factor in the latest price-sensitive company announcements or qualitative material. Simply Wall St has no position in any stocks mentioned.
Have feedback on this article? Concerned about the content? Get in touch with us directly. Alternatively, email editorial-team@simplywallst.com
