
 Yahoo Finance
 Rally fades following STI's inability to move above 3,250

CNY rally fades as STI loses momentum; 10-year US treasury yield gains strength
Although the US equity markets have managed to break into new high ground, the yield on 10-year US treasuries has moved above the flat 100-day moving average at 4.2373%, ending at 4.2786% on March 15. In addition, the trend of the 10-year yield comprises of a series of higher lows since December 2023, which implies that an uptrend, albeit minor, has developed.
The US market appears to be oblivious to the higher cost of capital caused by the rising risk-free rate. That could be because this is offset by better earnings outlook, and business conditions.
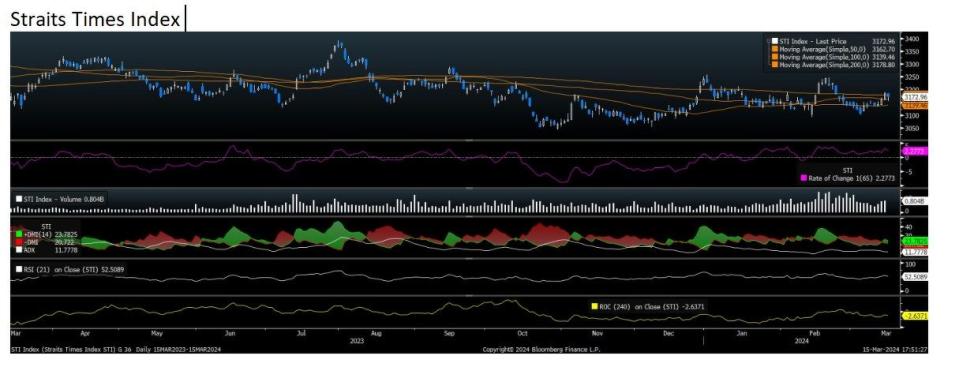
The Straits Times Index has no such luck. After a too brief Chinese New Year rally of sorts, there has been some recalibration. Increasingly, it appears that resistance has been established at twice tested 3,250. The STI was also unable to hold on to a support area around 3,150, and sank to 3,107 in the first week of March.
Indicators are neutral. However, the chart pattern isn’t encouraging as the index has been unable to move above the flat 200-day moving average at 3,178 decisively.
As such, the upside is likely to be limited to 3,250, and support should be lowered back to the twice tested 3,100 level. The STI closed at 3,172 on March 15,, up 25 points week-on-week, but down 57 points since the start of the year.
See Also:
Click here to stay updated with the Latest Business & Investment News in Singapore
Sharp retreat in risk-free rates buoys markets; STI to rally further
STI’s upside from breakout remains valid as risk-free rates fade, but stay watchful for FOMC
Get in-depth insights from our expert contributors, and dive into financial and economic trends
