
 Yahoo Finance
 Radian Group Inc's Dividend Analysis
Exploring the Sustainability of Radian Group Inc's Dividend Payments
Radian Group Inc (NYSE:RDN) recently announced a dividend of $0.25 per share, payable on 2024-06-20, with the ex-dividend date set for 2024-06-04. As investors look forward to this upcoming payment, the spotlight also shines on the company's dividend history, yield, and growth rates. Using the data from GuruFocus, let's look into Radian Group Inc's dividend performance and assess its sustainability.
What Does Radian Group Inc Do?
This Powerful Chart Made Peter Lynch 29% A Year For 13 Years
How to calculate the intrinsic value of a stock?
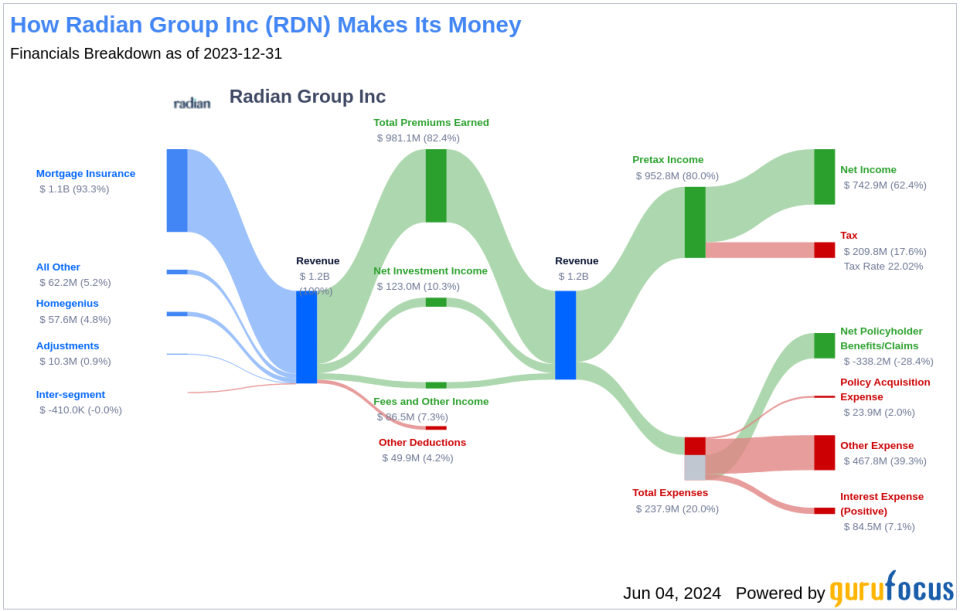
Radian Group Inc provides mortgage insurance and services to the real estate and mortgage finance industries. Radian's mortgage insurance provides coverage to lending institutions throughout the United States. Its services include analytics and consulting for buyers and sellers of, and investors in, mortgage- and real estate-related loans and securities and other asset-backed securities. Insurance premiums account for more than three fourths of the company's revenue. Services revenue and investment income are the other principal sources of revenue. It operates in two segments: Mortgage and homegenius. The Mortgage segment earns the majority of revenue.
A Glimpse at Radian Group Inc's Dividend History
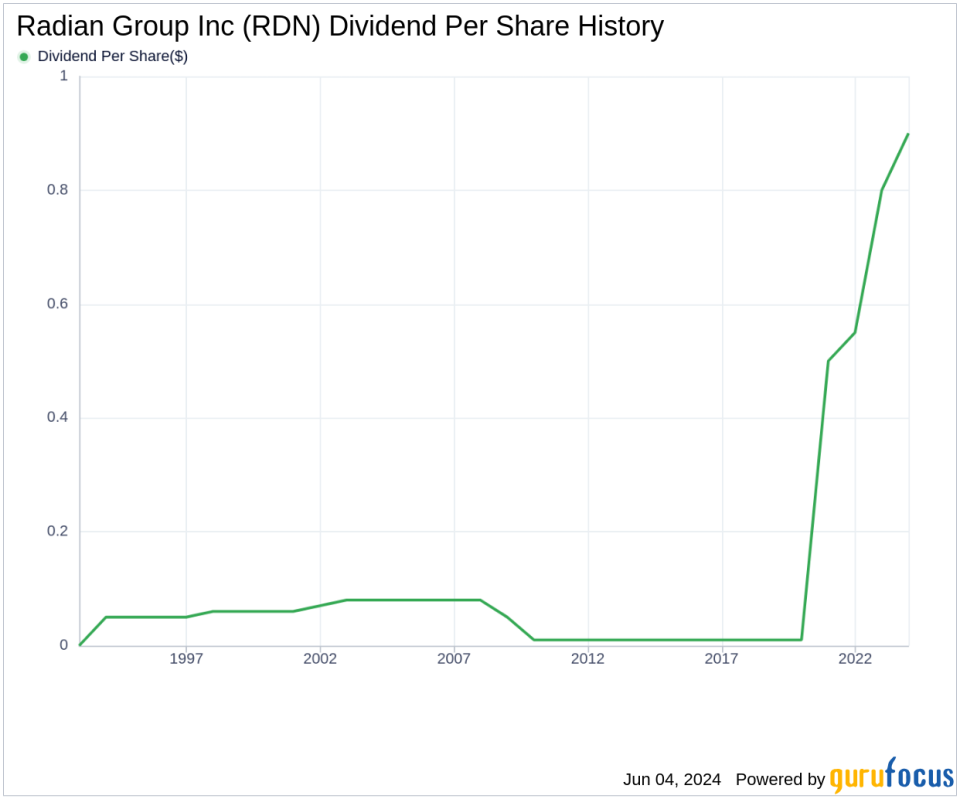
Radian Group Inc has maintained a consistent dividend payment record since 1993. Dividends are currently distributed on a quarterly basis. Radian Group Inc has increased its dividend each year since 2009. The stock is thus listed as a dividend achiever, an honor that is given to companies that have increased their dividend each year for at least the past 15 years. Below is a chart showing annual Dividends Per Share for tracking historical trends.
Breaking Down Radian Group Inc's Dividend Yield and Growth
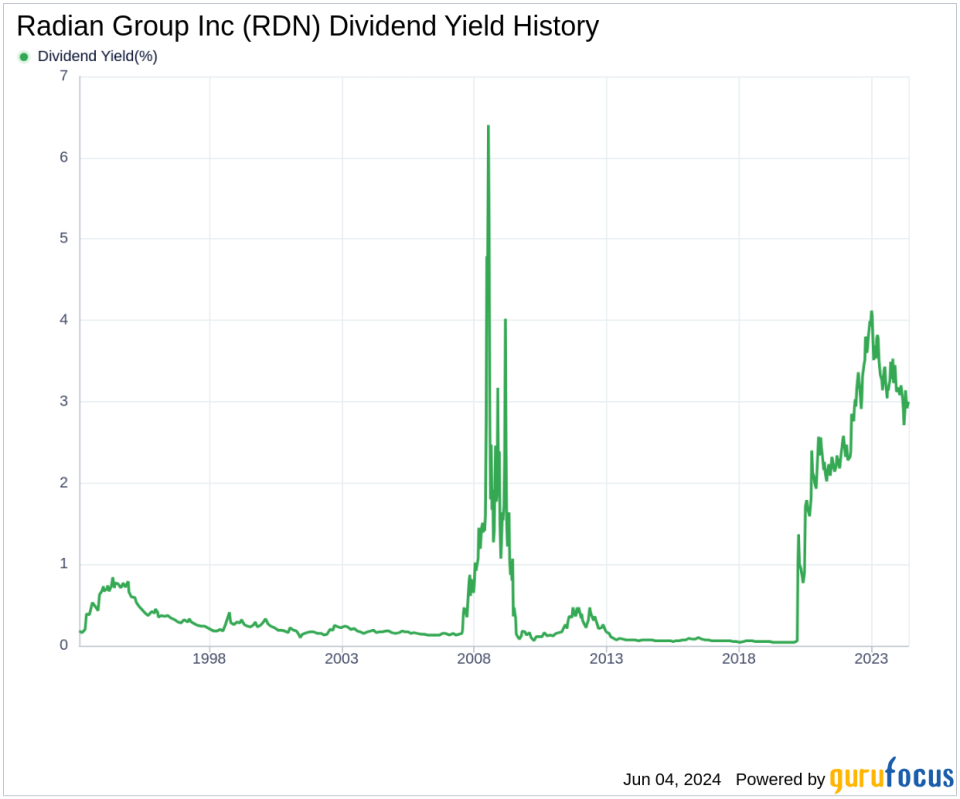
As of today, Radian Group Inc currently has a 12-month trailing dividend yield of 2.87% and a 12-month forward dividend yield of 3.08%. This suggests an expectation of increased dividend payments over the next 12 months. Over the past three years, Radian Group Inc's annual dividend growth rate was 21.60%. Extended to a five-year horizon, this rate increased to 177.60% per year. And over the past decade, Radian Group Inc's annual dividends per share growth rate stands at an impressive 72.30%.
Based on Radian Group Inc's dividend yield and five-year growth rate, the 5-year yield on cost of Radian Group Inc stock as of today is approximately 473.13%.
The Sustainability Question: Payout Ratio and Profitability
To assess the sustainability of the dividend, one needs to evaluate the company's payout ratio. The dividend payout ratio provides insights into the portion of earnings the company distributes as dividends. A lower ratio suggests that the company retains a significant part of its earnings, thereby ensuring the availability of funds for future growth and unexpected downturns. As of 2024-03-31, Radian Group Inc's dividend payout ratio is 0.23.
Radian Group Inc's profitability rank, offers an understanding of the company's earnings prowess relative to its peers. GuruFocus ranks Radian Group Inc's profitability 7 out of 10 as of 2024-03-31, suggesting good profitability prospects. The company has reported positive net income for each of year over the past decade, further solidifying its high profitability.
Growth Metrics: The Future Outlook
To ensure the sustainability of dividends, a company must have robust growth metrics. Radian Group Inc's growth rank of 7 out of 10 suggests that the company's growth trajectory is good relative to its competitors.
Revenue is the lifeblood of any company, and Radian Group Inc's revenue per share, combined with the 3-year revenue growth rate, indicates a strong revenue model. Radian Group Inc's revenue has increased by approximately 1.90% per year on average, a rate that underperforms than approximately 65.05% of global competitors.
The company's 3-year EPS growth rate showcases its capability to grow its earnings, a critical component for sustaining dividends in the long run. During the past three years, Radian Group Inc's earnings increased by approximately 30.60% per year on average, a rate that underperforms than approximately 21.98% of global competitors.
Lastly, the company's 5-year EBITDA growth rate of 11.10%, which underperforms than approximately 34.56% of global competitors.
Next Steps
Considering Radian Group Inc's consistent dividend payments, impressive dividend growth rate, manageable payout ratio, solid profitability, and growth metrics, the company presents a compelling case for dividend investors. However, prospective investors should also consider the underperformance in certain growth metrics relative to global competitors, which could influence future dividend sustainability. GuruFocus Premium users can screen for high-dividend yield stocks using the High Dividend Yield Screener.
This article, generated by GuruFocus, is designed to provide general insights and is not tailored financial advice. Our commentary is rooted in historical data and analyst projections, utilizing an impartial methodology, and is not intended to serve as specific investment guidance. It does not formulate a recommendation to purchase or divest any stock and does not consider individual investment objectives or financial circumstances. Our objective is to deliver long-term, fundamental data-driven analysis. Be aware that our analysis might not incorporate the most recent, price-sensitive company announcements or qualitative information. GuruFocus holds no position in the stocks mentioned herein.
This article first appeared on GuruFocus.
