
 Yahoo Finance
 Is Quest Diagnostics Incorporated's (NYSE:DGX) Recent Stock Performance Influenced By Its Fundamentals In Any Way?
Quest Diagnostics (NYSE:DGX) has had a great run on the share market with its stock up by a significant 13% over the last three months. Given that stock prices are usually aligned with a company's financial performance in the long-term, we decided to study its financial indicators more closely to see if they had a hand to play in the recent price move. Particularly, we will be paying attention to Quest Diagnostics' ROE today.
Return on Equity or ROE is a test of how effectively a company is growing its value and managing investors’ money. In other words, it is a profitability ratio which measures the rate of return on the capital provided by the company's shareholders.
Check out our latest analysis for Quest Diagnostics
How Is ROE Calculated?
The formula for return on equity is:
Return on Equity = Net Profit (from continuing operations) ÷ Shareholders' Equity
So, based on the above formula, the ROE for Quest Diagnostics is:
14% = US$899m ÷ US$6.5b (Based on the trailing twelve months to March 2024).
The 'return' is the amount earned after tax over the last twelve months. Another way to think of that is that for every $1 worth of equity, the company was able to earn $0.14 in profit.
What Is The Relationship Between ROE And Earnings Growth?
We have already established that ROE serves as an efficient profit-generating gauge for a company's future earnings. We now need to evaluate how much profit the company reinvests or "retains" for future growth which then gives us an idea about the growth potential of the company. Assuming everything else remains unchanged, the higher the ROE and profit retention, the higher the growth rate of a company compared to companies that don't necessarily bear these characteristics.
Quest Diagnostics' Earnings Growth And 14% ROE
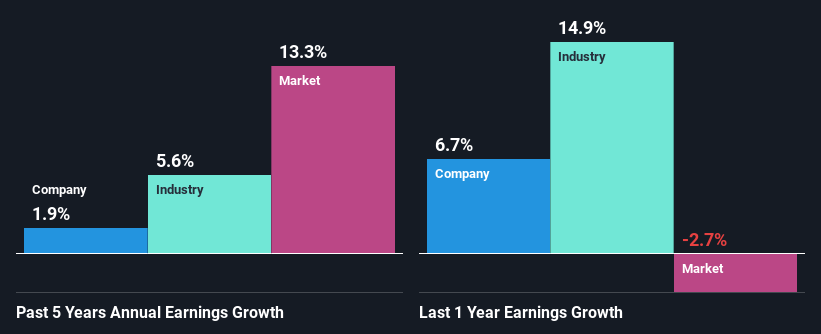
To start with, Quest Diagnostics' ROE looks acceptable. Especially when compared to the industry average of 11% the company's ROE looks pretty impressive. Despite this, Quest Diagnostics' five year net income growth was quite flat over the past five years. Therefore, there could be some other aspects that could potentially be preventing the company from growing. For example, it could be that the company has a high payout ratio or the business has allocated capital poorly, for instance.
Next, on comparing with the industry net income growth, we found that Quest Diagnostics' reported growth was lower than the industry growth of 5.6% over the last few years, which is not something we like to see.
Earnings growth is an important metric to consider when valuing a stock. It’s important for an investor to know whether the market has priced in the company's expected earnings growth (or decline). Doing so will help them establish if the stock's future looks promising or ominous. One good indicator of expected earnings growth is the P/E ratio which determines the price the market is willing to pay for a stock based on its earnings prospects. So, you may want to check if Quest Diagnostics is trading on a high P/E or a low P/E, relative to its industry.
Is Quest Diagnostics Using Its Retained Earnings Effectively?
Quest Diagnostics has a low three-year median payout ratio of 25% (or a retention ratio of 75%) but the negligible earnings growth number doesn't reflect this as high growth usually follows high profit retention.
Moreover, Quest Diagnostics has been paying dividends for at least ten years or more suggesting that management must have perceived that the shareholders prefer dividends over earnings growth. Our latest analyst data shows that the future payout ratio of the company over the next three years is expected to be approximately 29%. Accordingly, forecasts suggest that Quest Diagnostics' future ROE will be 15% which is again, similar to the current ROE.
Conclusion
Overall, we feel that Quest Diagnostics certainly does have some positive factors to consider. Yet, the low earnings growth is a bit concerning, especially given that the company has a high rate of return and is reinvesting ma huge portion of its profits. By the looks of it, there could be some other factors, not necessarily in control of the business, that's preventing growth. With that said, the latest industry analyst forecasts reveal that the company's earnings are expected to accelerate. Are these analysts expectations based on the broad expectations for the industry, or on the company's fundamentals? Click here to be taken to our analyst's forecasts page for the company.
Have feedback on this article? Concerned about the content? Get in touch with us directly. Alternatively, email editorial-team (at) simplywallst.com.
This article by Simply Wall St is general in nature. We provide commentary based on historical data and analyst forecasts only using an unbiased methodology and our articles are not intended to be financial advice. It does not constitute a recommendation to buy or sell any stock, and does not take account of your objectives, or your financial situation. We aim to bring you long-term focused analysis driven by fundamental data. Note that our analysis may not factor in the latest price-sensitive company announcements or qualitative material. Simply Wall St has no position in any stocks mentioned.
