
 Yahoo Finance
 Promisia Healthcare (NZSE:PHL) Shareholders Will Want The ROCE Trajectory To Continue
If you're looking for a multi-bagger, there's a few things to keep an eye out for. Typically, we'll want to notice a trend of growing return on capital employed (ROCE) and alongside that, an expanding base of capital employed. This shows us that it's a compounding machine, able to continually reinvest its earnings back into the business and generate higher returns. Speaking of which, we noticed some great changes in Promisia Healthcare's (NZSE:PHL) returns on capital, so let's have a look.
Return On Capital Employed (ROCE): What Is It?
For those that aren't sure what ROCE is, it measures the amount of pre-tax profits a company can generate from the capital employed in its business. The formula for this calculation on Promisia Healthcare is:
Return on Capital Employed = Earnings Before Interest and Tax (EBIT) ÷ (Total Assets - Current Liabilities)
0.035 = NZ$2.8m ÷ (NZ$84m - NZ$3.8m) (Based on the trailing twelve months to March 2024).
Therefore, Promisia Healthcare has an ROCE of 3.5%. In absolute terms, that's a low return, but it's much better than the Healthcare industry average of 0.5%.
See our latest analysis for Promisia Healthcare
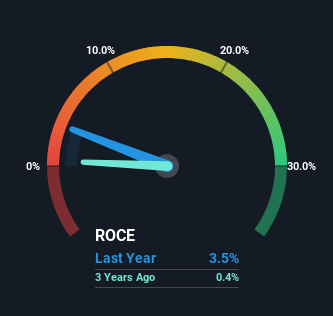
Historical performance is a great place to start when researching a stock so above you can see the gauge for Promisia Healthcare's ROCE against it's prior returns. If you want to delve into the historical earnings , check out these free graphs detailing revenue and cash flow performance of Promisia Healthcare.
What The Trend Of ROCE Can Tell Us
Even though ROCE is still low in absolute terms, it's good to see it's heading in the right direction. The data shows that returns on capital have increased substantially over the last three years to 3.5%. The amount of capital employed has increased too, by 57%. The increasing returns on a growing amount of capital is common amongst multi-baggers and that's why we're impressed.
What We Can Learn From Promisia Healthcare's ROCE
In summary, it's great to see that Promisia Healthcare can compound returns by consistently reinvesting capital at increasing rates of return, because these are some of the key ingredients of those highly sought after multi-baggers. Astute investors may have an opportunity here because the stock has declined 50% in the last five years. So researching this company further and determining whether or not these trends will continue seems justified.
Promisia Healthcare does come with some risks though, we found 4 warning signs in our investment analysis, and 2 of those are a bit concerning...
If you want to search for solid companies with great earnings, check out this free list of companies with good balance sheets and impressive returns on equity.
Have feedback on this article? Concerned about the content? Get in touch with us directly. Alternatively, email editorial-team (at) simplywallst.com.
This article by Simply Wall St is general in nature. We provide commentary based on historical data and analyst forecasts only using an unbiased methodology and our articles are not intended to be financial advice. It does not constitute a recommendation to buy or sell any stock, and does not take account of your objectives, or your financial situation. We aim to bring you long-term focused analysis driven by fundamental data. Note that our analysis may not factor in the latest price-sensitive company announcements or qualitative material. Simply Wall St has no position in any stocks mentioned.
