
 Yahoo Finance
 Project Spotlight: This Sentosa condo defied trend with 197 profitable transactions
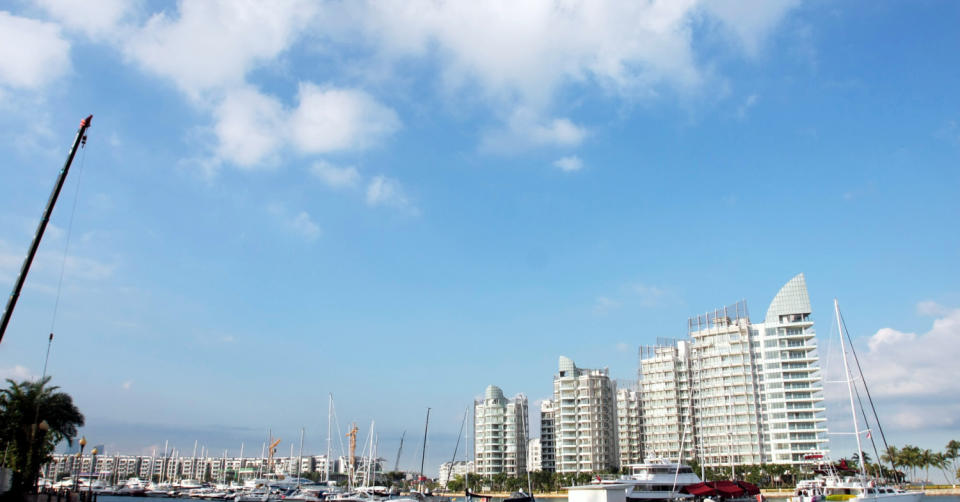
The Oceanfront @ Sentosa Cove has the most number of profitable transactions among all condos in Sentosa. (Photo: Samuel Isaac Chua/EdgeProp Singapore)
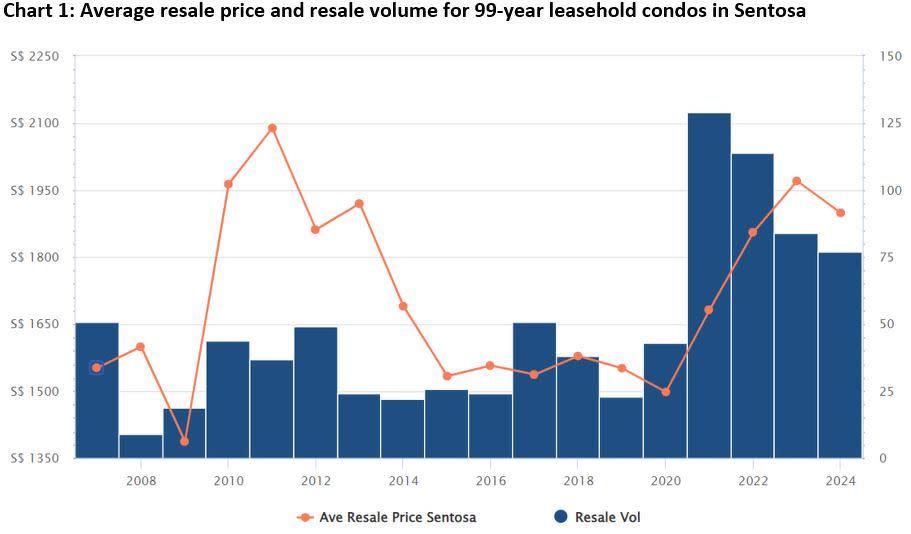
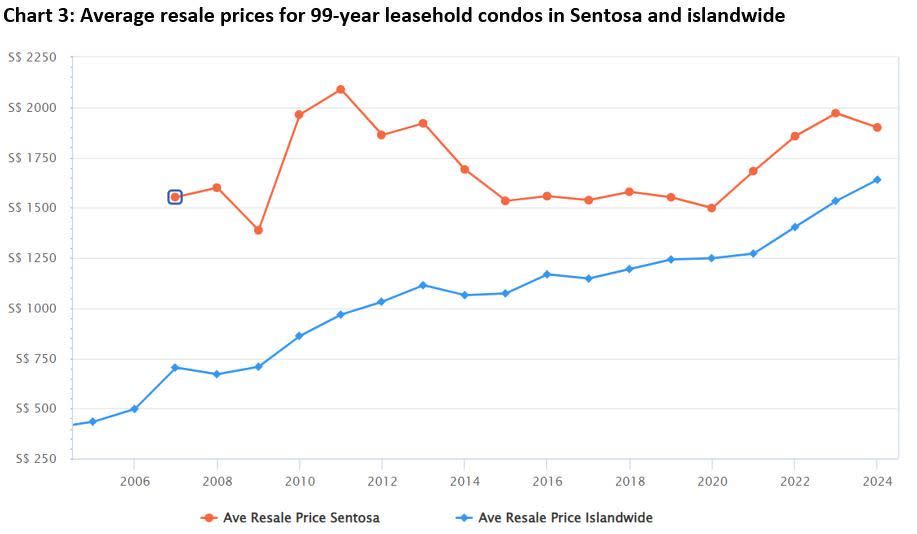
SINGAPORE (EDGEPROP) - Buyers often perceive homes in Sentosa as exclusive but expensive. Many also believe that owning condos there usually does not yield a profit. However, that assumption may not be true because the average resale price for 99-year leasehold condos in Sentosa has grown 22.4% since 2007. It has also shown growth during the pandemic, increasing from $1,498 psf in 2020 to $1,970 psf last year.
The average price dipped by 3.6% y-o-y to $1,899 psf this year, which could be attributed to the attractive discounts offered for The Residences at W Singapore Sentosa Cove during its relaunch in April. The discount also gave a boost to the resale volume for this year. At the time of writing, 77 condo units in Sentosa have been sold this year. The Residences at W Singapore Sentosa Cove accounted for 56 units or 72.7% of the total resale volume.
Source: EdgeProp Market Trends (as at 5 June 2024)
For our project spotlight this week, we took a deeper look at The Oceanfront @ Sentosa Cove to determine why this project has the highest number of profitable transactions among condos in Sentosa. Since its launch, The Oceanfront @ Sentosa Cove has had 197 profitable and 86 unprofitable transactions.
Read also: ANALYSIS: Are larger units really in greater demand after the pandemic?
At the time of writing, The Coast at Sentosa Cove has had 105 profitable and 67 unprofitable transactions. The Berth by The Cove and The Azure have had 29 unprofitable transactions each. The Berth by The Cove has had 174 profitable transactions while The Azure has had 96 profitable transactions.
Why The Oceanfront @ Sentosa Cove bucked the trend
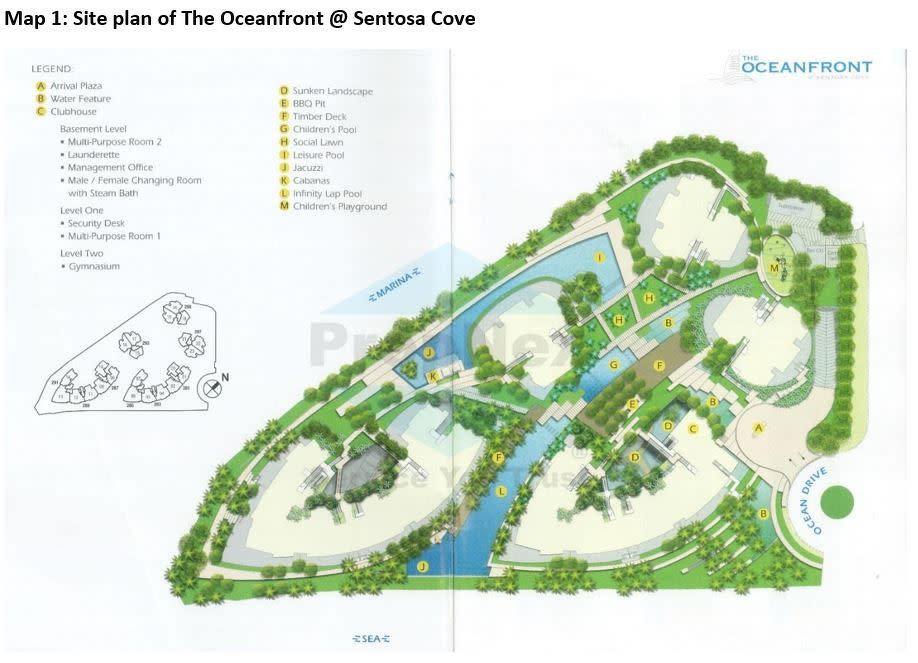
The Oceanfront @ Sentosa Cove is located along Ocean Drive in Sentosa and obtained its temporary occupation permit (TOP) in 2010. The 99-year leasehold development features 264 units, comprising two to four-bedroom units as well as five-bedroom penthouses. The units measure from 1,216 sq ft to 8,095 sq ft. Depending on the direction their unit faces, residents have excellent views of the sea, the marina, or one of the three pools in the development.
Sentosa is a smaller island connected to the main island of Singapore via a land bridge. There are over 300 landed homes, 10 condos, and a strata-landed development in Sentosa Cove. It is the only place in Singapore where foreigners can purchase landed homes without having to obtain government approval.
All residential developments in Sentosa have tenures of 99 years, so buyers who wish to own a residential property in Sentosa do not have the option of purchasing a freehold property. Furthermore, the number of residential properties in Sentosa is limited by the lack of available land for new residential developments.
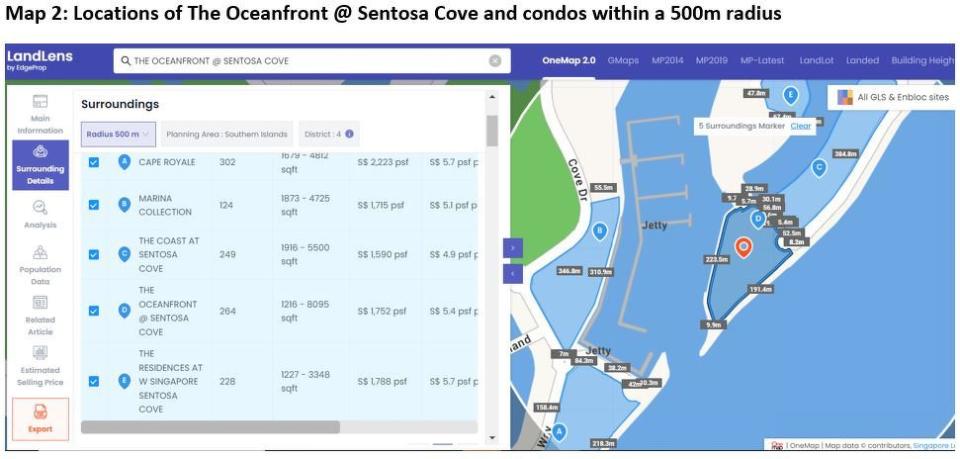
There are four condos within a 500-meter radius of The Oceanfront @ Sentosa Cove, namely Cape Royale, Marina Collection, The Coast at Sentosa Cove, and The Residences at W Sentosa Cove.
Source: EdgeProp LandLens (as at 5 June 2024)
Defying assumptions with 197 profitable transactions
At the time of writing, The Oceanfront @ Sentosa Cove has had 197 profitable and 86 unprofitable transactions out of 336 resale and sub-sale transactions. Profits range from approximately $888 to $3.57 million, while losses range from approximately $5,480 to $2.21 million. The 197 profitable transactions represent 58.6% of the total transactions in the secondary market for the development. The Oceanfront @ Sentosa Cove also has the highest number of profitable transactions among its counterparts in Sentosa.
Read also: Is it a Good Deal?: The seller for this Sentosa condo lost $1.75 million
It is noteworthy that the top three profitable transactions for the development are for larger units measuring at least 3,000 sq ft, each yielding profits of at least $3 million. All three units were also purchased by their respective sellers in 2006 when the development was first launched.
Additionally, the sellers of the units that yielded the top two highest profits sold the units less than two years after purchasing them. Readers should note that seller’s stamp duty (SSD) did not apply to these two transactions because the units were sold before SSD was first introduced in February 2010.
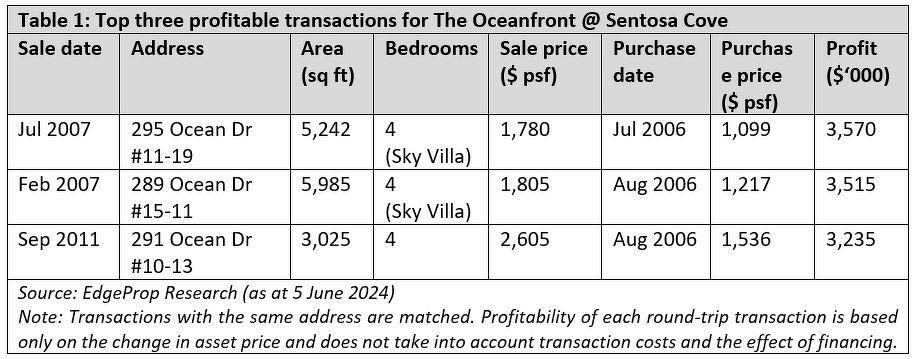
The top three most profitable transactions took place more than 10 years ago, so we examined more recent transactions to determine if The Oceanfront @ Sentosa Cove is still generating profits for its sellers.
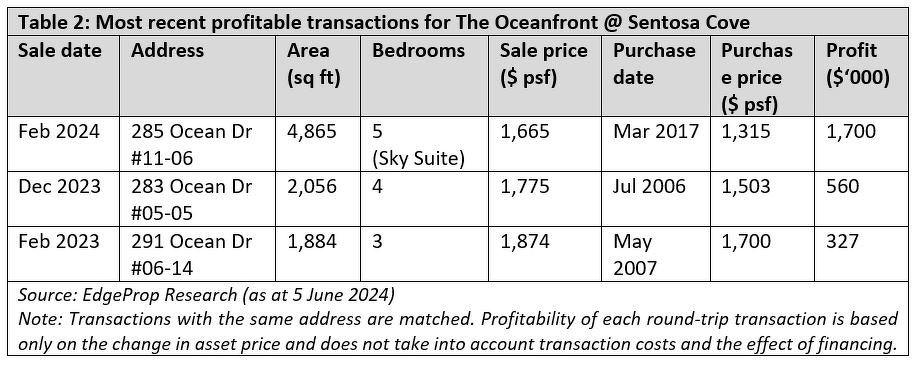
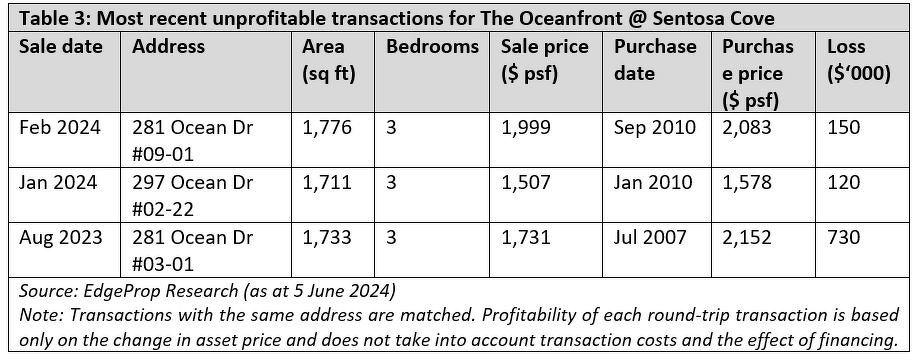
A total of seven resale transactions took place from 2023 to 2024. Of these seven transactions, three were profitable and three were unprofitable. We were unable to determine the profitability of the remaining transaction because no earlier sale caveat was lodged for the unit. The sale that took place in the recent two years could be the first transaction for the unit.
Readers might want to note that URA defines the sale of a unit by the developer or a subsequent buyer as a resale if the certificate of statutory completion and subsidiary strata certificates of titles or the certificates of titles for all units in the development have been issued.
It is notable that the three most recent profitable transactions feature a wider range of unit types compared to the top three most profitable transactions. Additionally, the recent transactions generated smaller profits for their sellers, with only one transaction yielding a profit of more than $1 million.
Read also: OPINION: Is it time to review ABSD rates?
All three of the most recent unprofitable transactions are for three-bedroom units measuring approximately 1,700 sq ft. These three transactions resulted in losses of less than $800,000, which is at the lower end of the loss spectrum for The Oceanfront @ Sentosa Cove.
Higher recent profits than nearest neighbour
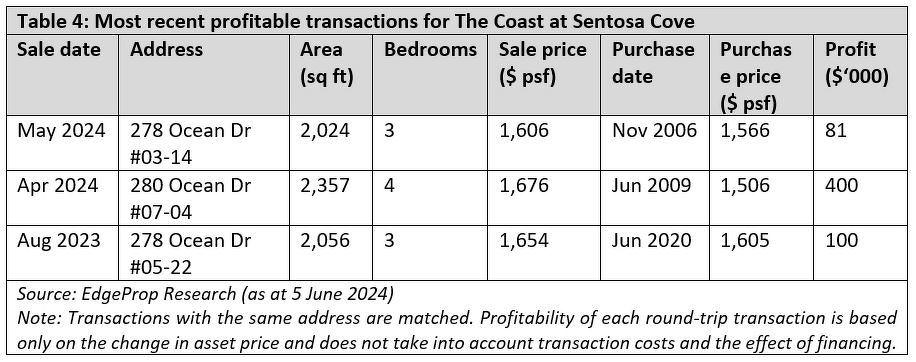
Among the four condos within walking distance of The Oceanfront @ Sentosa Cove, only The Coast at Sentosa Cove had profitable transactions in 2023 or 2024.
The Coast at Sentosa Cove is located along Ocean Drive and is adjacent to The Oceanfront @ Sentosa Cove. The 99-year leasehold development is a year older than The Oceanfront @ Sentosa Cove, having obtained its TOP in 2009. All units in the 249-unit development have at least three bedrooms.
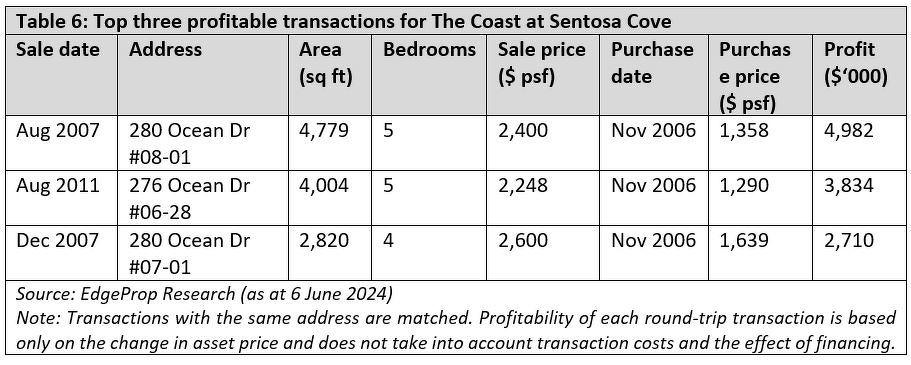
Since its launch in 2006, The Coast at Sentosa Cove has had 105 profitable and 67 unprofitable transactions out of 227 resale and sub-sale transactions. Profits range from approximately $2,720 to $4.98 million, while losses range from approximately $400 to $6.17 million.
The three most recent profitable transactions for The Coast at Sentosa Cove fetched approximately $1,600 psf. With the exception of the transaction for the four-bedder, the units generated lower profits compared to the three most recent profitable transactions for The Oceanfront @ Sentosa Cove.
Similar price growth
The average resale price for The Oceanfront @ Sentosa Cove has been higher than that for The Coast at Sentosa Cove since 2020. However, the average prices for both condos have been below that for 99-year leasehold condos in Sentosa Cove since 2021.
The current average resale prices for The Oceanfront @ Sentosa Cove and The Coast at Sentosa Cove are $1,724 psf and $1,641 psf, respectively. Despite having a lower average price, The Coast at Sentosa Cove has shown stronger price growth of 15.7% since 2020, compared to a growth of 10.3% for The Oceanfront @ Sentosa Cove over the same timeframe. The current average resale price for leasehold condos in Sentosa is higher than the two condos at $1,899 psf. Leasehold condos in Sentosa also displayed a stronger price growth of 26.8% since 2020.

Source: EdgeProp Market Trends (as at 5 June 2024)
Oddly, in this case, timing the market is more important than time in the market
It is noteworthy that the unit in The Oceanfront @ Sentosa Cove that generated the highest profit of approximately $3.57 million also yielded the second-highest loss of $2.13 million. This is probably due to the different market conditions when the transactions took place.
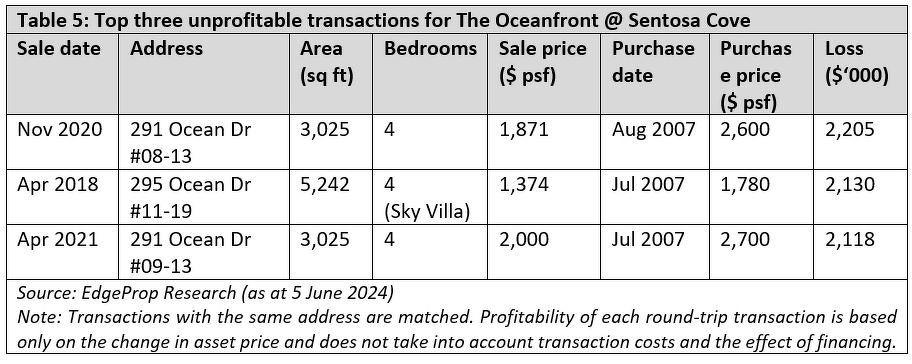
The unit on the eleventh floor was first purchased in July 2006 and sold a year later for a profit of approximately $3.57 million. The same unit was then sold in April 2018 for a loss of approximately $2.13 million.
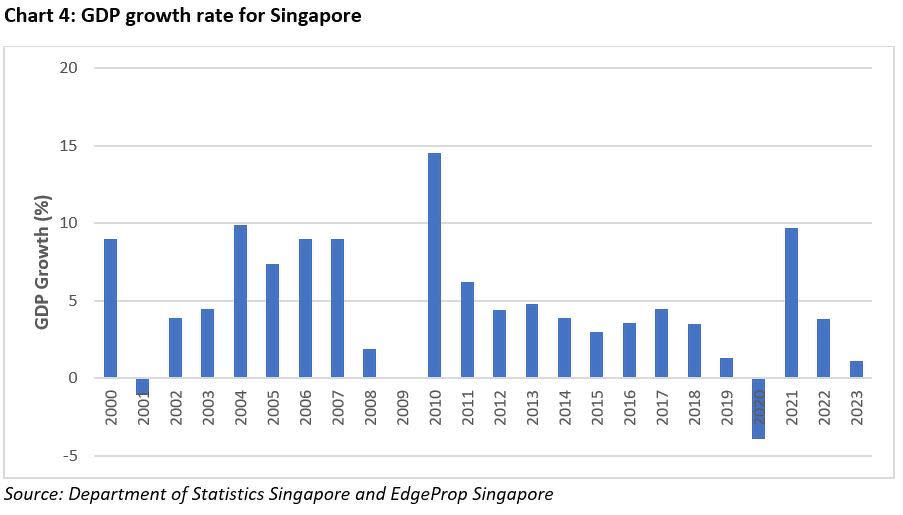
The profit enjoyed by the first seller could be attributed to a price surge of 41.4% y-o-y to $703 psf for leasehold resale condos in Singapore that year, up from a growth of 14.5% y-o-y to $497 psf in 2006. There were no resale transactions for leasehold condos in Sentosa prior to 2007.
The significant price growth was propelled by a low housing supply. In 2006 and 2007, only 6,520 and 6,513 condos were completed, a far cry from the 10,122 units completed in 2008. Singapore’s property market also benefited from strong foreign interest in 2007. Foreigners bought 1,074 resale leasehold condo units in 2007, up from 493 units in the previous year.
Source: EdgeProp Market Trends (as at 6 June 2024)
The loss suffered by the second seller could be due to a more subdued market in 2018. That year, the average resale price for leasehold condos grew by 4.2% y-o-y for condos islandwide and by 2.7% y-o-y for condos in Sentosa. GDP growth rate was weaker at 3.5% y-o-y in 2018 compared to growth rates of 4.5% y-o-y in 2017 and 9% y-o-y in 2007.
It is also interesting to note that all of the top three most profitable transactions for The Oceanfront @ Sentosa Cove and The Coast at Sentosa Cove took place in 2007 and 2011.
A record high GDP growth rate of 14.5% y-o-y in 2010 could have contributed to a 12.3% y-o-y increase to $967 psf in the average resale price for condos in Singapore in 2011. The average price for leasehold condos in Sentosa increased by 6.4% y-o-y to a record high of $2,089 psf in 2011. However, the introduction of additional buyer's stamp duty (ABSD) in December 2011 soon put the brakes on further housing price increase.
Regular layouts attract demand
The unit that yielded the highest profit and the second-highest loss is a Sky Villa with four bedrooms and measures 5,242 sq ft. The unit has a dumbbell layout, with a massive en-suite master bedroom with a walk-in wardrobe occupying one end of the unit. The other end of the unit has an en-suite junior master bedroom as well as two bedrooms sharing a common bathroom. The living area, dining room, and kitchen are sandwiched between the bedrooms. There is also a small study nook near the master bathroom.
The bedrooms and living area in the unit are regularly shaped despite the overall irregular shape of the unit due to the way that the different rooms are laid out. However, this resulted in an irregularly-shaped balcony and private pool.
The unit also features a second storey with an entertainment room, a private pool, and open-air terraces. Residents who entertain frequently will appreciate the second storey but it may be deemed as a waste of space by those who prefer more indoor space.

Source: EdgeProp Research
The units that yielded the highest loss of $2.21 million and the third-highest loss of $2.12 million share the same floor layout. These single-storey units have four bedrooms and measure 3,025 sq ft. They are also shaped like a triangular wedge with an irregularly-shaped balcony at the pointed end. The irregularly-shaped unit also means that some of the rooms are slanted at an angle.
The units also have a smaller en-suite master bedroom compared to the most profitable unit. The occupant of the master bedroom will also have less privacy because the master bedroom does not occupy the entire corner of the unit. There is a second en-suite master bedroom sharing the same corner. The other two bedrooms and a common bathroom are located at another corner of the unit.
Source: EdgeProp Research
Conclusion
There is renewed interest in condos located in Sentosa because of the recent transactions for The Residences at W Singapore Sentosa Cove during its relaunch in April.
The Oceanfront @ Sentosa Cove has had 197 profitable transactions since its launch. However, the majority of the profitable transactions for The Oceanfront @ Sentosa Cove could be attributed to owners selling their units during a bullish market. The unit on the eleventh floor that fetched the highest profit and second-highest loss is an excellent example of how market conditions at the time of sale can impact profitability for the seller.
Owners of The Oceanfront @ Sentosa Cove who purchased their units years ago might still see profits, albeit smaller ones, if they decide to sell. The development remains a desirable location. Notably, 149 out of the 197 profitable transactions occurred before 2012, with profitable sales transacting as recent as this year.
Check out the latest listings for The Oceanfront @ Sentosa Cove, The Coast At Sentosa Cove, The Residences At W Singapore Sentosa Cove properties
See Also:
Singapore Property for Sale & Rent, Latest Property News, Advanced Analytics Tools
New Launch Condo & Landed Property in Singapore (COMPLETE list & updates)
ANALYSIS: Are larger units really in greater demand after the pandemic?
Is it a Good Deal?: The seller for this Sentosa condo lost $1.75 million
En Bloc Calculator, Find Out If Your Condo Will Be The Next en-bloc
