
 Yahoo Finance
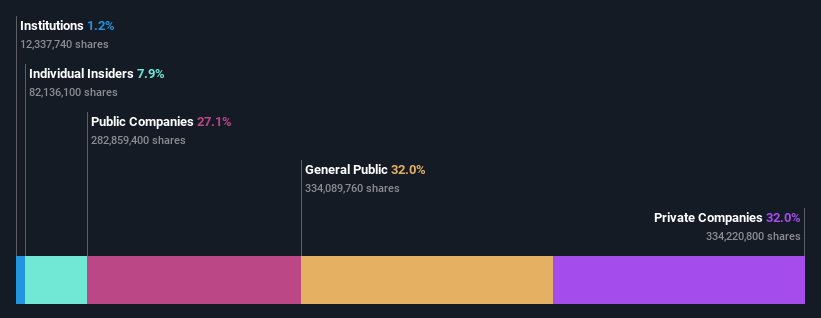
 Private companies account for 32% of Dyna-Mac Holdings Ltd.'s (SGX:NO4) ownership, while individual investors account for 32%
Key Insights
Dyna-Mac Holdings' significant private companies ownership suggests that the key decisions are influenced by shareholders from the larger public
The top 2 shareholders own 55% of the company
Past performance of a company along with ownership data serve to give a strong idea about prospects for a business
Every investor in Dyna-Mac Holdings Ltd. (SGX:NO4) should be aware of the most powerful shareholder groups. And the group that holds the biggest piece of the pie are private companies with 32% ownership. That is, the group stands to benefit the most if the stock rises (or lose the most if there is a downturn).
Meanwhile, individual investors make up 32% of the company’s shareholders.
Let's take a closer look to see what the different types of shareholders can tell us about Dyna-Mac Holdings.
View our latest analysis for Dyna-Mac Holdings
What Does The Institutional Ownership Tell Us About Dyna-Mac Holdings?
Institutions typically measure themselves against a benchmark when reporting to their own investors, so they often become more enthusiastic about a stock once it's included in a major index. We would expect most companies to have some institutions on the register, especially if they are growing.
Since institutions own only a small portion of Dyna-Mac Holdings, many may not have spent much time considering the stock. But it's clear that some have; and they liked it enough to buy in. If the company is growing earnings, that may indicate that it is just beginning to catch the attention of these deep-pocketed investors. It is not uncommon to see a big share price rise if multiple institutional investors are trying to buy into a stock at the same time. So check out the historic earnings trajectory, below, but keep in mind it's the future that counts most.

We note that hedge funds don't have a meaningful investment in Dyna-Mac Holdings. The company's largest shareholder is Estate of Lim Tze Jong, with ownership of 32%. For context, the second largest shareholder holds about 23% of the shares outstanding, followed by an ownership of 6.1% by the third-largest shareholder. In addition, we found that Ah Cheng Lim, the CEO has 1.1% of the shares allocated to their name.
To make our study more interesting, we found that the top 2 shareholders have a majority ownership in the company, meaning that they are powerful enough to influence the decisions of the company.
While it makes sense to study institutional ownership data for a company, it also makes sense to study analyst sentiments to know which way the wind is blowing. While there is some analyst coverage, the company is probably not widely covered. So it could gain more attention, down the track.
Insider Ownership Of Dyna-Mac Holdings
The definition of an insider can differ slightly between different countries, but members of the board of directors always count. Company management run the business, but the CEO will answer to the board, even if he or she is a member of it.
I generally consider insider ownership to be a good thing. However, on some occasions it makes it more difficult for other shareholders to hold the board accountable for decisions.
Shareholders would probably be interested to learn that insiders own shares in Dyna-Mac Holdings Ltd.. It has a market capitalization of just S$397m, and insiders have S$31m worth of shares, in their own names. It is good to see some investment by insiders, but it might be worth checking if those insiders have been buying.
General Public Ownership
The general public-- including retail investors -- own 32% stake in the company, and hence can't easily be ignored. This size of ownership, while considerable, may not be enough to change company policy if the decision is not in sync with other large shareholders.
Private Company Ownership
We can see that Private Companies own 32%, of the shares on issue. It might be worth looking deeper into this. If related parties, such as insiders, have an interest in one of these private companies, that should be disclosed in the annual report. Private companies may also have a strategic interest in the company.
Public Company Ownership
We can see that public companies hold 27% of the Dyna-Mac Holdings shares on issue. It's hard to say for sure but this suggests they have entwined business interests. This might be a strategic stake, so it's worth watching this space for changes in ownership.
Next Steps:
I find it very interesting to look at who exactly owns a company. But to truly gain insight, we need to consider other information, too.
I always like to check for a history of revenue growth. You can too, by accessing this free chart of historic revenue and earnings in this detailed graph.
But ultimately it is the future, not the past, that will determine how well the owners of this business will do. Therefore we think it advisable to take a look at this free report showing whether analysts are predicting a brighter future.
NB: Figures in this article are calculated using data from the last twelve months, which refer to the 12-month period ending on the last date of the month the financial statement is dated. This may not be consistent with full year annual report figures.
Have feedback on this article? Concerned about the content? Get in touch with us directly. Alternatively, email editorial-team (at) simplywallst.com.
This article by Simply Wall St is general in nature. We provide commentary based on historical data and analyst forecasts only using an unbiased methodology and our articles are not intended to be financial advice. It does not constitute a recommendation to buy or sell any stock, and does not take account of your objectives, or your financial situation. We aim to bring you long-term focused analysis driven by fundamental data. Note that our analysis may not factor in the latest price-sensitive company announcements or qualitative material. Simply Wall St has no position in any stocks mentioned.
